Table Of Contents
What Is Opening Range?
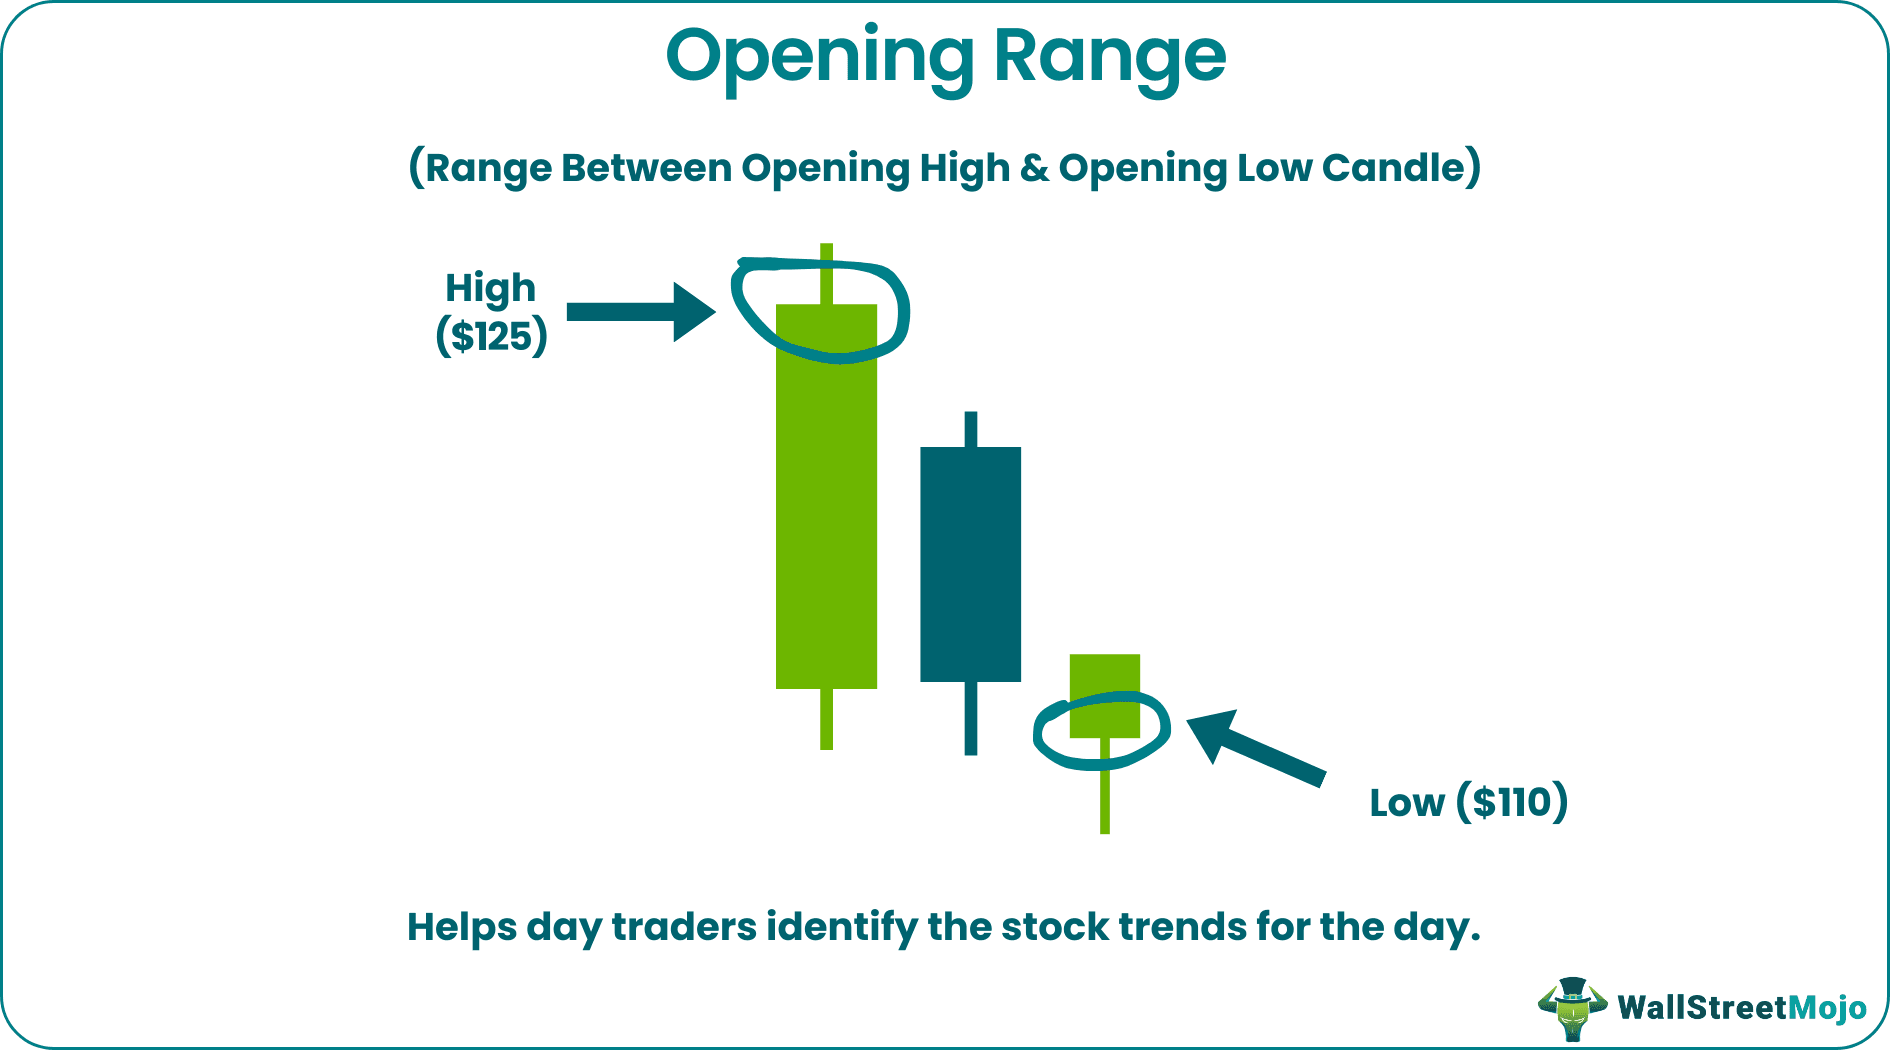
Opening Range refers to the difference between the security's high and the low candle for a given period after the market opens. This range is usually volume, price, or time-based and covers 5, 15, 30 minutes, or 1 hour. It helps the day traders identify the stock trends for the day.
Traders use this method to book profits for the entire trading session. It serves as an indicator of overall market consensus for them as the market opens. The market is the most volatile during the first 30 minutes. Thus, the traders react to the market, trade, and try to maximize profits. However, they can make losses if they ignore the morning range.
Table of contents
- What Is Opening Range?
- The opening range is the gap between the security's high and low candles in the early morning trading session. Price, volume, and time can influence this range. For example, the time gap can be 5, 15, 30, or 60 minutes.
- The traders use this trading strategy to determine the support and resistance levels of the market. However, there can be fake breakouts that can lead to wrong trading decisions.
- There are three types of opening range strategy: early morning range breakout, chart pattern gap pullback, and gap reversal. The factors influencing the strategy are price, volume, and time.
Opening Range Trading Explained
The opening range trading strategy refers to a strategy that the traders develop after watching the first 30 minutes of the market.
This theory gained importance during the 1960s when American trader and investor Arthur Merrill used it for 20 years. Later, Geoff Bysshe, another expert trader, gave the '10 O'clock Bulls' theory. It stated that the first thirty minutes of the market are highly active and volatile. These thirty mins are emotionally charged and information-packed. The investor trades as per the news released before the trading session. It also provides support and resistance for the rest of the day.
As per the theory, most trading (i.e., 35%) happens in this initial range. Later, in 2010, analysts Mehmet Emre Cekirdekci and V. Iliev expanded the 10 O'clock Bulls theory. Finally, in 2013, stock market researchers Ulf Holmberg, Christian Lundström, and Carl Lönnbark presented a graphical view of this range.
While observing a stock market chart, technical analysts often find the trading range as a power indicator. Traders often monitor the range before and after intense market volatility. They develop it when they feel the market will break the upward or downward range. Then, they plot entry points on the stock price chart to predict day trends.
Traders use multiple forms of patterns to track the trending range. They also compare the previous day's stock opening with the current price to determine the day's trend. Finally, they use technical analysis scanners like the opening range breakout scanner to calculate and pick the right stock.
Investors or traders follow the trending ranges of a stock's price around a major announcement that may affect the prices. Examples include the release of firm earning reports, changes in management, the launch of new products, and other such things. Thus, the range helps them to predict the changes in price directions.
Many traders use Saxo Bank International to research and invest in stocks across different markets. Its features like SAXO Stocks offer access to a wide range of global equities for investors.
Opening Range Breakout
Opening range breakout gives investors and technical analysts a clear insight into the market. For example, some traders might go for the first 5 to 15 minutes, while others might choose the 30 to 60 minutes range. However, professionals watch for 50-60 minutes high and low ranges as the first few minutes depict a hectic trade. These breakouts are often subjective.
Breakouts often provide trading opportunities. Breakouts on the upside indicate day traders cover long or short positions. A downside breakout indicates traders sell long or cover short positions. Fake breakouts are when prices move to the high or low candles. If the prices quickly move back after touching the high or low candles, it indicates a fake breakout.
The more volatile the initial range, the less effective it is to trade that stock. However, if the range tilts, there is a possibility of a breakout. For example, if the investor feels the market will outperform his expectations, he will go for a long position. Likewise, in case of negative market sentiments, there will be a bearish trading opening range breakout.
Opening Range Types
Let us look at the types of opening range trading strategies:
#1 - Early Morning Range Breakout
As the name refers, traders make profits in the early morning session when the market opens. It focuses on the gap size between the opening high and low. However, the trader has to follow certain rules in this trade. First, they need to enter the market before the 5-minutes opening candle, along with volume confirmation. In simple words, if there is a high volume, it indicates a breakout candle.
#2 - Chart Pattern Gap Pullback
This opening range trading strategy works when a trader notices a particular trend. Now, the trend could be bullish or bearish. The rule states that traders should pullback their position when the trend changes. However, predicting the trend reversal is difficult. Thus, traders should put a stop loss below the initial range low.
#3 - Gap Reversal
In gap reversal, the price creates a gap and moves in the opposite direction. As a result, the price breaks the low range and falls when there is a bullish gap. Likewise, in the bearish gap, the price breaks the high range. However, the trader should place a stop loss in the middle of the starting range to protect against losses.
The three factors for determining the opening range trading strategy include–
- Price
- Volume
- Time
Pros And Cons
The initial range offers various benefits to the traders. It includes trend identification, booking profits, and market volatility. However, it has certain risks associated with them.
For example, while traders generate profits during breakouts, it can mislead them sometimes. Sometimes, there are fake breakouts that stay for a very limited time. As a result, the traders can fall victim to the smart money trap.
| Pros | Cons |
|---|---|
| Identifies trends | Fake Breakouts |
| Analyze market volatility | Maximum time breakout |
| Maximize profits |
Examples
Let us look at the opening range examples to understand the concept better:
Example #1
Suppose Taylor is an intra-day trader engaged in equity. On Friday evening, Apple Inc. announced the release of quarter four results. There was hype among the public about high revenue figures. The next day, the market absorbed and reflected all the news. In the first 30 minutes of the session, the initial range high was $158, and the low was $152.61. There was a huge buying of the stock that led to a bullish trend.
Example #2
Berkshire Hathaway is a well-known conglomerate in the market. On April 30, 2022, the company declared its first quarter results. The earnings were not immune to the global crisis, and the market absorbed this information. In the first 15 mins of the trading session (i.e., May 2, 2022), the starting range high was $322.23, and the low was 320.59. As a result, the traders saw a bearish trend for the whole trading session.
Disclosure: This article contains affiliate links. If you sign up through these links, we may earn a small commission at no extra cost to you.

Frequently Asked Questions (FAQs)
Following are the steps to trade opening range breakout:
- Identify the high and low within the initial range
- Draw support and resistance levels
- Watch the price go above or below the levels drawn.
- Once breakout happens, place your order and trade.
The opening range high means the stock's highest price during a given time frame. So, if a stock rises to $120 during the initial 30 minutes, that is the highest range.
To determine the range, a trader must understand the stock well. For example, studying the stock and the previous session's high and low can help to determine the initial range.
When the stock breaks the price of the first 1-minute candle, it is known as a 1-minute opening range breakout. Then, depending on the trader and market sentiments, it can be either short or long.
