Table Of Contents
One-Way ANOVA Definition
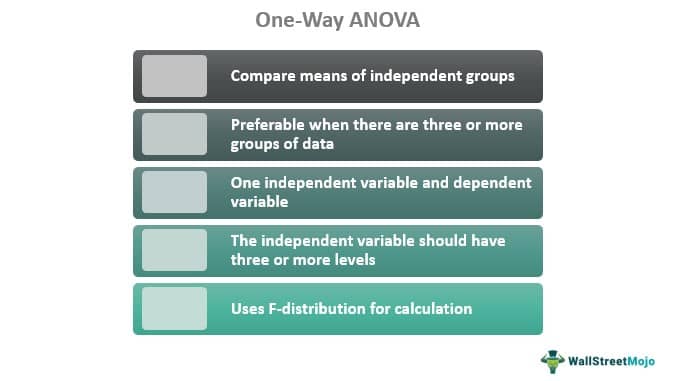
One-Way ANOVA is a statistical method used to compare the mean value of samples to check whether they are significantly different. Also, the method uses only one independent variable.
It's a type of analysis of variance commonly used in research fields like science, biology, business, economics, and psychology to analyze datasets. Generally, it performs the comparison of three or more data groups. Generally, its comparison occurs with the two-way ANOVA method. The difference is that two-way ANOVA has two independent variables.
Key Takeaways
- One-way ANOVA refers to a type of ANOVA test where there will be only one independent variable. The test compares means of groups, generally three or more groups, to analyze the variance.
- Some of the assumptions followed are the adherence to the samples selected from a normally distributed population, independence of the samples, homogeneity of variance, etc.
- The dependent variable should be continuous, and the one categorical independent variable selected should have three levels or groups.
- It is commonly used in research fields like science, biology, business economics, and psychology to analyze datasets.
- It is often compared with two way ANOVA test. The difference is that the two-way ANOVA test contains two independent variables.
One-Way ANOVA Formula
The calculation method involves the comparison of means from independent groups using F-distribution. In other words, it is the comparison between the group variance and within the group variance.
Let us look into the one-way ANOVA formula:
F-statistics or F-ratio:
F = MSB/MSW
In this formula,
- F = coefficient of ANOVA
- MSB = Mean sum of squares between the groups
- MSW = Mean sum of squares within groups
The test formulates a null hypothesis and an alternative hypothesis. The null hypothesis states that all population means are equal, whereas the alternative hypothesis states that at least one population mean will vary from others.
Comparing the F statistics calculated to the critical F value obtained from the F table will give prolific information. The result is significant if the F statistic is larger than the F value. A significant result points to the difference in means. If the F-statistics is 1 or close to 1, then the two variances are equal and state that the null hypothesis is true.
Assumptions
- Data samples should be taken from the normally distributed population.
- Samples should be selected randomly to ensure that observations in one sample do not depend on the observations in other samples. In essence, samples should be independent.
- The dependent variable should be continuous.
- The variance of data belonging to different groups should be the same.
- In a group, there should not be any data point exhibiting an unusual pattern.
- The independent variable should contain three or more levels.
One-Way Anova Example
Examples of one-way ANOVA include using it to determine whether weight loss is best achieved through diet type 1, diet type 2, or diet type 3. The dependent variable would be "weight loss," measured in kilograms, and the independent variable would be "diet type," which has three groups or levels: "diet type 1", "diet type 2," and "diet type 3".
Another example shows that researchers can use it to understand whether there is a difference in income based on education level. Here the dependent variable would be "income," and the independent variable would be "education level," which has three groups: "bachelor's," "master's," and "doctoral."
Another example is its application to analyze the impact of different study programs. For this specific number of groups are randomly formed, and provided different study programs for each group. Here, the dependent variable is the performance or scores, and the independent variable is the type of study program.
In medical fields, a scientist engaged in the drug development process can use this method to test the effect of three different drugs on glucose concentration in the blood. The drug is the independent variable in the test, and glucose concentration is the dependent variable.
When to Use?
The right time to use it is when the researcher has a question or statement regarding the population sample. The researcher wants to find, prove or reject it by obtaining evidence. The test helps researchers to accept or reject the null hypothesis. The test is appropriate when there are three or more groups to compare and establish a difference between them. Also, there will be only one independent variable, with three levels or categorical independent groups. The test can reveal whether at least two groups were different from each other. But the result won't disclose which groups had a difference in means. Furthermore, there are analytical tools or software applications for one-way ANOVA like SPSS, SAS, R, and MATLAB.
