Table Of Contents
What is One Variable Data Table in Excel?
One variable Data Table in Excel means changing the one variable along with multiple options and getting the results for numerous scenarios.
Video Explanation of One Variable Data Table in Excel
How to Create a One Variable Data Table in Excel? (with Examples)
Example #1
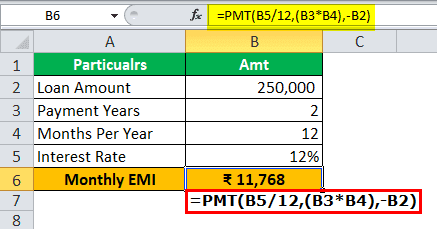
You are taking a loan of ₹2,50,000 for 2 years. You are in discussion with the loan officer concerning the interest rates.
You need to analyze the monthly payment you need to pay at different interest rates to clear the loan. For the calculation, take the base rate of 12% per annum.
| Particulars | Amt |
|---|---|
| Loan Amount | 250,000 |
| Payment Years | 2 |
| Month Per Year | 12 |
| Interest Rate | 12% |
| Monthly EMI | ? |
Below are the steps for calculating monthly EMI using the PMT function:
- Calculate the monthly EMI using the PMT function.

- We must create a scenario table, as shown in the image below.

- Select cell E9 and link to cell B6 (EMI Amount). Now, cell E9 shows the monthly EMI.

- Select the range from D9 to E22.

- Click on the Data tab, then What-if Analysis and Data Table.

- The Data Table dialogue box will appear. In the Column input cell, select cell B5 (which contains the basic loan interest rate).
In one variable data table in Excel, we always ignore either the Row input cell or Column input cell. It depends on our table structure. For example, suppose our scenario table different interest rates are vertical. In that case, we ignore the row input cell, and if our scenario table interest rates are horizontal, we overlook the column input cell. In this example, we have missed the Row input cell because the scenario table's different interest rates are vertical.
- Click on the OK button to create different scenarios.

Now, the range E10:E22 shows some new values. From the table, it is clear that @12.5% interest rate monthly EMI will be ₹11,827, and @13.5% interest rate monthly EMI would be ₹11,944, and so on.
Like this, one variable data table works in Excel. You can also show this in a chart.
Example #2
Assume you are a sales manager of a company. From the management, you have received your team's monthly sales target of $1,70,000. The below table shows the sales target of 6 members. It would help if you analyzed what should be their efficiency level to hit the target of $1.7 lakh in a month.

Your team’s overall target is $2.04 lakhs. However, you are not sure at what percentage of efficiency they need to bring to the table to achieve the target given by the management.
Your team can give a maximum of 90% efficiency level. You have calculated the total revenue at a 90% efficiency level.

At a 90% efficiency level, your team can achieve total revenue of $1.83 lakh monthly. Therefore, you need to know the efficiency level to achieve the revenue target given by the management.
Create a scenario table, as shown in the below image.
- Step 1: You must create an Excel file below the table.

This table shows at different efficiency levels what the revenue will be.
- Step 2: Select cell H3 and link to cell B11 (at 90% efficiency level revenue cell). Now, the cell H3 cell shows a 90% efficiency level revenue.

- Step 3: Select the range from G3 to H12.

- Step 4: Find the "Data Table" under the "What-if Analysis" section.

- Step 5: Once we click on "Data Table," we need to give a link in the "Column input cell," select cell B10 (that contains efficiency percentage).
For the "Column input cell," we have given the link to cell B10 because we will create the scenarios based on the different efficiency levels. The data table now understands that at 90%, revenue will be $1.83 lakh. Similarly, it will create scenarios for 100%, 95%, 90%, 85%, 80% and so on.

- Step 6: Click on "OK" to create different scenarios.

Now the range G3:H12 shows scenarios. Management has given the target of $1.70 lakh for this month. To achieve that much revenue, your team must perform at an efficiency level of at least 85%.
This way, you can use a data table to create different analyses and choose a suitable scenario to achieve the goals.
Things to Remember
- Once the scenarios have been made, we cannot undo the action. It will remain the same.
- We cannot modify the cell values because it becomes an array formula excel. We must delete everything, not one by one.
- In a one variable data table, we must always leave out the "Row input cell" if the scenario is to be shown in the vertical form. If the scenario is to be shown in the horizontal form, leave the "Column input cell."
- We can change the value in the main database to see the real-time results at different types of alternatives.

