Table Of Contents
One-Sample T-Test Meaning
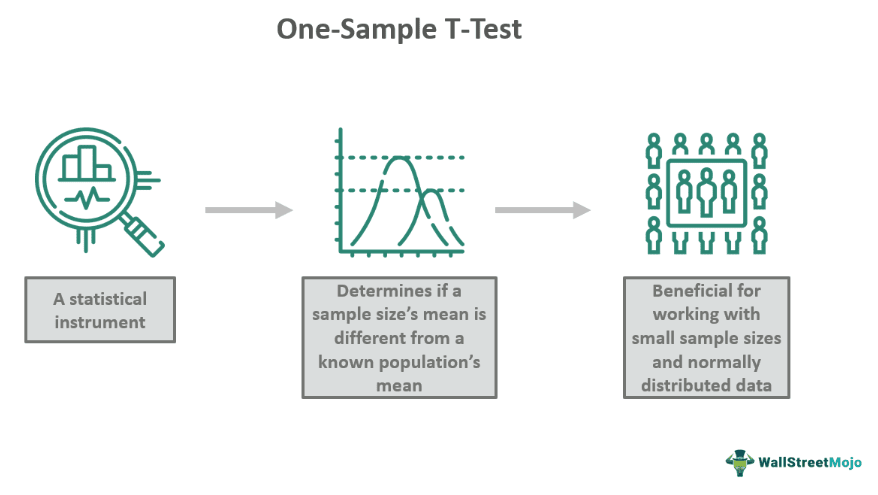
The one-sample T-test is a statistical method that helps determine if the mean of a single sample is significantly different from a known or supposed population mean. It is valuable for working with small sample sizes and normally distributed data. The test allows researchers and analysts to draw meaningful conclusions from limited data.
The one-sample t-test involves calculating the t-statistic by taking the mean of the sample, subtracting the assumed population mean, and then dividing by the standard error of the mean. It is widely used in research across several domains to examine if a sample is representative of a larger population.
Key Takeaways
- A one-sample T-test is a statistical approach that determines if the mean of a single sample varies substantially from a known or assumed population mean.
- Researchers and analysts can use the test to make insightful inferences from limited data. Several fields of study, including psychology, biological sciences, and finance, commonly use the test.
- It aids in establishing conclusions about a sample's representativeness of a larger population or determining the success rate of a specific program.
One-Sample T-Test Explained
A one-sample t-test is an essential tool in statistics that aid in assessing if the mean of a sample is significantly at odds with a recognized or theorized population mean. It assumes that the data are approximately normally distributed and the variability within the sample is relatively consistent. This test is functional when the sample size is small, which is usually less than 30, and when working with numerical data.
The one-sample t-test is widely used in various fields, including psychology, biology, and economics. It assists in concluding a sample's representativeness of a larger population or in determining the effectiveness of a particular intervention. The test provides an effective statistical method to study the population's specifications based on a single sample.
Assumptions
The one-sample t-test assumptions are:
- Random Sampling: The data should be collected using a random sampling method. It implies that each element in the population has an equal chance of being included in the sample. This process helps avoid biases and ensures that the sample represents the population.
- Normality: The data should follow a normal distribution as it ensures the accuracy of the results.
- Independence: The observations within the sample must be independent of each other. This one-sample t-test assumption implies that one observation should not influence another. It ensures that the data points are distinct and not interconnected.
Formula
The one-sample t-test formula is as follows:
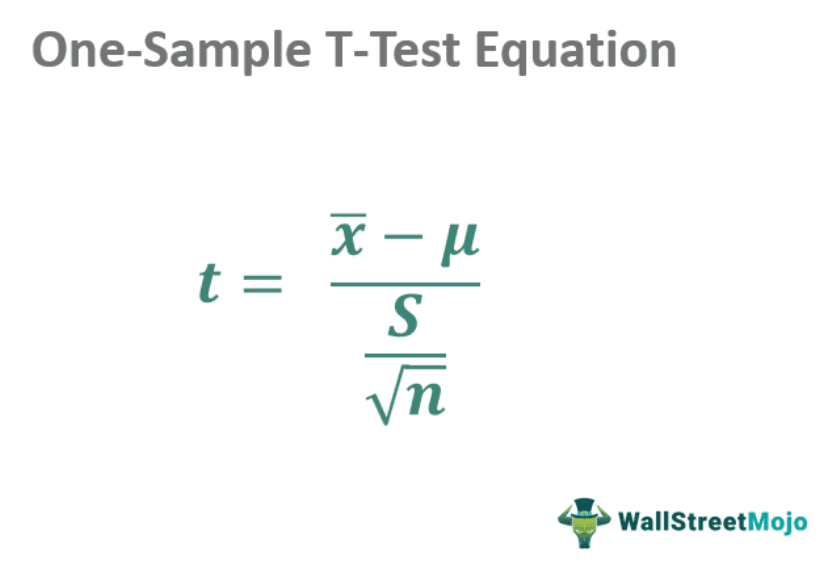
Where,
X̄ = sample mean
μ = hypothesized population mean
S = standard deviation of the sample
n = number of sample observations.
Examples
Let us study the following examples to understand this test:
Example #1
Suppose Jake is an investor analyzing 12 quarterly returns of a stock. He expects a mean quarterly return of 6%. The sample's mean return is 7.2%, with a standard deviation of 2.5%. Using the one-sample t-test formula, X̄=7.2%, μ=6%, S=2.5%, and n=12, the t-statistic is calculated as 1.92. If the number of degrees of freedom is known, the crucial t-value can be calculated using the t-value table. If the determined t-value is below the critical t-value, there is no significant difference between the sample and the population. However, if it is above the critical t-value, a significant difference exists.
Example #2
Suppose a pharmaceutical company claimed that its new medication reduced blood pressure by ten mmHg in one month. Amy was interested to know if their claim was accurate. She did this by comparing the observed fall in blood pressure of 75 test individuals to the expected reduction of ten mmHg. Amy discovered that the medicine did not live up to its promises after performing an in-depth study. This is another example of a one-sample t-test.
Applications
Some applications of this test include:
- Industries use it to ensure product consistency. It helps assess whether the mean strength of a sample of products matches the desired strength standards.
- The test is beneficial for evaluating customer satisfaction scores or preferences to determine if they significantly differ from an expected value. This process involves assessing if the average rating of a new product significantly differs from a predetermined benchmark.
- Medical research uses this test for comparing patient outcomes or medical test results against a known or expected average. It helps determine if a treatment's effects significantly differ from a predetermined value. Moreover, it might assist in assessing if the effectiveness of a drug significantly differs from the expected response.
- It helps in economic research for analyzing if the average income, expenditure, or growth in a particular region significantly differs from a national or global average. It can also be used to evaluate if the impact of a policy significantly alters economic indicators.
One-Sample T-Test vs Two-Sample T-Test
The differences between the two are as follows:
One-Sample T-Test
- It compares the mean of a single sample to a known or hypothesized population mean.
- The test determines if the sample mean significantly differs from the given population mean.
- It is commonly used when there is a single group or condition to evaluate.
Two-Sample T-Test
- Two-Sample T-test compares the means of two independent samples to evaluate if they significantly differ from each other.
- It assesses whether the means of two distinct groups are significantly different.
- The test is a valuable tool when examining the effects of two different conditions, treatments, or groups. For instance, it is applied in scenarios like medical trials to compare the effectiveness of two drugs.
