Table Of Contents
Normal Distribution in Excel (NORMDIST)
NORMDIST or normal distribution is an inbuilt statistical function of Excel that calculates the normal distribution of a data set for which the mean and standard deviation are given.
NORMDIST function accepts four arguments–X value, mean, standard deviation, and cumulative value. Excel 2010 replaced the NORMDIST function with NORM.DIST function.
Syntax
The syntax of the normal distribution in Excel is mentioned as follows:

The arguments of the NORM.DIST function are listed as follows:
- X: This is the value for which we calculate the normal distribution.
- Mean: This is the average value of the distribution, i.e., the mean value.
- Standard Deviation: This is the standard deviation of the distribution.
- Cumulative: This is a logical value that determines the type of distribution to be used.
If the cumulative value is “true,” the function returns the cumulative normal distribution function (CDF). If the cumulative value is “false,” the function returns the normal probability density function (PDF).
Note: The NORMDIST function exists in the recent versions of Excel to support compatibility with the previous versions. However, it may not be available in future versions of Excel.

How to Use NORMDIST in Excel? (With Examples)
Example #1
We have the stock price data of an organization. The stipulated stock price is 115, the overall average stock price is 90, and the standard deviation is 16.
We need to calculate the probability of the stock price at and below 115.

Let us apply the NORM.DIST in Excel.
X is the initial stock price. The mean is the overall average price. The standard deviation is given in cell B4. The distribution type used is “1,” meaning TRUE.

The result is 0.9409, which means roughly 94% of the stocks have a price below 115. In other words, the chance that the stock has a price above 115 is less than 6%.

Let us change the distribution type to the normal probability density function, i.e., FALSE (0). We get the following result.

The NORM.DIST function returns the value 0.0074, indicating that 0.74% of the stocks have their price equal to 115.
Example #2
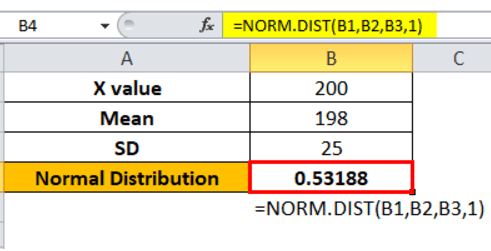
Let us consider the following data for normal distribution in Excel.
- Sample of the population (X) = 200
- Mean or average value = 198
- Standard deviation = 25

Let us apply cumulative normal distribution in Excel.

The normal distribution value is 0.53188, i.e., the probability is 53.18%.

The Characteristics of the Normal Distribution Function
- The NORM.DIST function accepts only numerical values.
- The NORMDIST function returns “#NUM! error” if the standard deviation supplied is less than or equal to zero.
- The NORMDIST function returns “#VALUE! error” if any of the supplied arguments is a non-numeric value.
- The normal PDF is a bell-shaped curve.
- The NORM.DIST function requires the mean and standard deviation which can be calculated by average function and STDEV.S function respectively.

