Table Of Contents
What Is A Non-Moving Inventory?
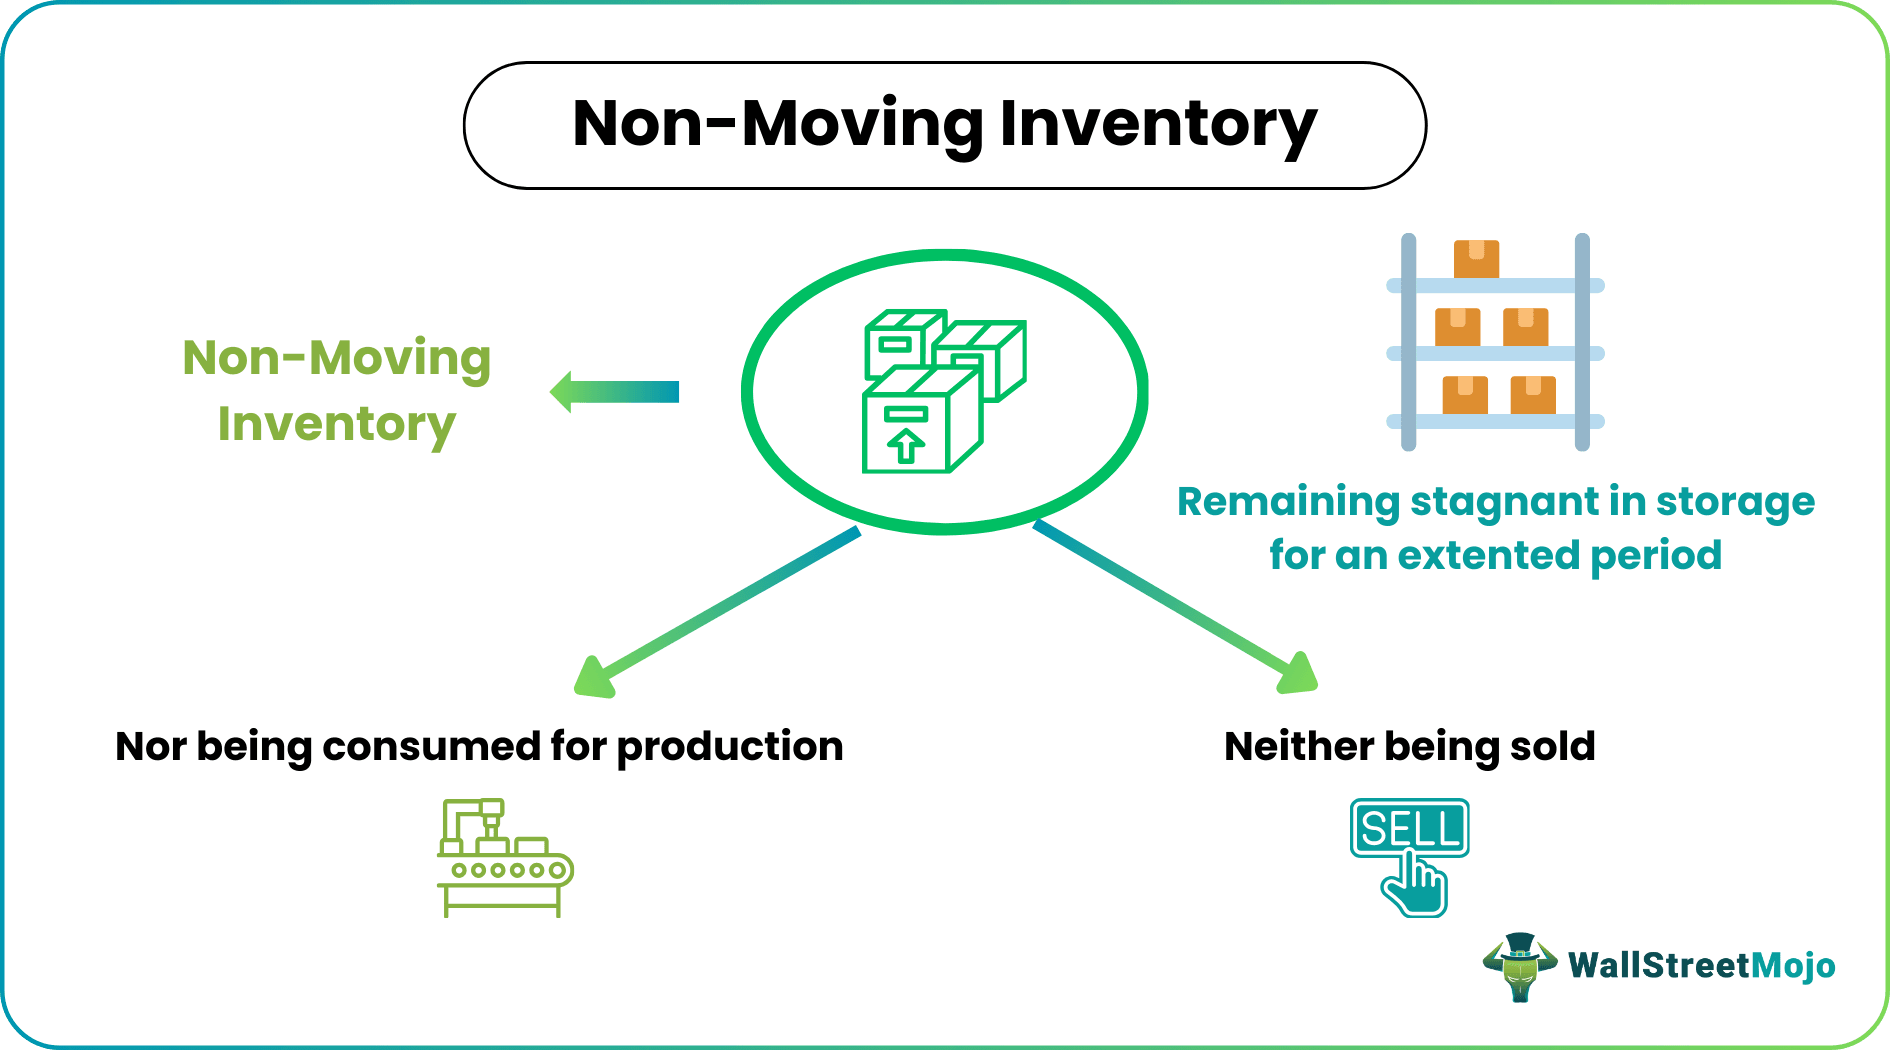
Non-moving inventory refers to those products or goods in stock that have not been sold or used within a specified period. Piled-up stagnant inventory items raise concerns of blocked capital, storage problems, obsolescence, and financial losses, ultimately hindering the organization's overall productivity and supply chain efficiency.
Organizations may experience nearly dead inventory due to factors like shifts in consumer demand, inaccurate sales projections, seasonal variations, or external influences such as economic downturns. Additionally, products may become obsolete due to technological advancements or evolving industry trends. Many business entities need help with getting rid of such stagnant stock without incurring heavy losses.
Table of contents
- What Is A Non-Moving Inventory?
- Non-moving inventory is the products or goods in stock that remain unsold or have not been utilized for production within a specific time frame. Such items become obsolete over the period, resulting in financial losses to the company.
- Effectively managing non-moving inventory by implementing strategies like accurate demand forecasting and regular reassessment of stock levels is essential to improve productivity, mitigate financial risks, and enhance overall supply chain efficiency.
- It differs from slow-moving inventory, which are those items that sell but at a slower pace than anticipated.
Non-Moving Inventory Explained
Non-moving inventory refers to unsold goods within a timeframe, common in industries with perishable or rapidly changing products. Factors like seasonal trends, shifts in preferences, overstocking, and economic downturns contribute to this challenge. The consequences include financial losses, blocked capital, and increased holding costs, leading to obsolescence and low market value.
Maintaining stagnant inventory impacts storage, cash flow, and profitability, potentially harming a business's reputation. Analysis and strategic solutions are crucial to identify causes and enhance inventory management. Monitoring shelf life, demand shifts, and product relevance helps minimize idle inventory, requiring regular adjustments in management strategies to prevent financial challenges.
Companies can implement promotions or re-evaluate batch sizes to avoid overstocking. In severe cases, businesses may resort to liquidation or write-offs for obsolete stagnant stock. Proactive measures ensure efficient inventory management and mitigate the risks associated with non-moving inventory.
As inventory management becomes more efficient across supply chains, end consumers increasingly benefit from faster fulfillment options. Services like Shipt now enable same-day grocery delivery, reflecting how real-time inventory systems support timely access to everyday essentials without requiring a trip to the store.
How To Identify?
The non-moving inventory analysis is indispensable in segregating the stock item into fast-moving, slow-moving, and non-moving (FSN) inventory. Moreover, analyzing FSN inventory effectively involves several critical steps, as discussed below:
- Find average stay and consumption rate:
- Ascertain the average stay by dividing the cumulative days of inventory by the opening balance plus goods received during the period.
- Calculate the consumption rate by dividing the total distributed products by the total days in the inventory period.
- Determine cumulative consumption rate and cumulative average stay calculation:
- Compute the cumulative average stay as the sum of the average stay for a specific item and that of items with more extended stays.
- Determine the cumulative consumption rate as the sum of the consumption rate for a product and that of faster-moving items.
- Convert to percentages:
- Derive the percentage average stay by dividing the cumulative average stay of one item by the total cumulative average stays of all items, then multiply by 100.
- Obtain the percentage consumption rate by dividing the cumulative consumption rate of one product by the total cumulative consumption rates of all items, multiplied by 100.
- Categorize items based on percentage:
- Classify fast-moving products with a cumulative stay of 10% or less and 70% of the average consumption rate.
- Identify slow-moving products with a cumulative stay of 20% or below and 20% of the average consumption rate.
- Spot the non-moving inventory items with a cumulative stay of 70% or less and an average consumption rate of 10% or less.
Examples
Let us now discuss a few examples of how the inventory becomes non-moving or stagnant:
Example #1
Suppose a smartwatch manufacturing company recently launched its latest collection featuring the new Android version. However, a box of 500 watches with the older Android version must still be sold six months after the new smartwatch launch. The company used various marketing strategies such as bundle offers and high discounts and sold 200 of these in two months. However, the remaining 300 watches were considered as non-moving inventory by the company after that. This stagnation is a result of technological advancement.
Example #2
Suppose a cheese distributor has two varieties of cheese, i.e., A and B. Below are the details of the respective inventory:
| Item | Cumulative days of inventory | Opening balance | Goods received during the period | Total quantity of products distributed | Total number of days in inventory |
|---|---|---|---|---|---|
| Cheese A | 30 | 200 kgs | 100 kgs | 5 kgs | 45 days |
| Cheese B | 40 | 220 kgs | 120 kgs | 120 kgs | 45 days |
Determine whether Cheese A is a non-moving inventory.
Solution:
For Cheese B:
Average Stay = Cumulative days of inventory ÷ (Goods received during the period + Opening balance) = 40 / (120 + 220) = 0.11
Consumption Rate = Total quantity of products distributed ÷ Total number of days in inventory = 120 / 45 = 2.67
For Cheese A:
Average Stay = Cumulative days of inventory ÷ (Goods received during the period + Opening balance) = 30 / (100 + 200) = 0.1
Consumption Rate = Total quantity of products distributed ÷ Total number of days in inventory = 5 / 45 = 0.11
Cumulative Average Stay = Average stay of Cheese A + Average stays of all items that stay longer in inventory = 0.1 + 0.11 = 0.21
Cumulative Consumption Rate = Consumption rate of Cheese A + Consumption rate of all items consumed faster = 0.11 + 2.67 = 2.78
Percentage Average Stay = (Cumulative average stay of Cheese A ÷ Cumulative average stay of all items) x 100 = (0.1/0.21) * 100 = 47.62%
Percentage Consumption Rate = (Cumulative consumption rate of Cheese A ÷ Cumulative consumption rate of all items) x 100 = (0.11/2.78) * 100 = 3.96%
Therefore, as we can see that the percentage average stay of Cheese A is below 70% and its percentage consumption rate is lower than 10%, it is a non-moving inventory for the company.
How To Reduce?
Reduce non-moving inventory with efficient strategies:
- Real-Time Monitoring:
- Predict demand accurately to align inventory with customer needs.
- Establish systems for early identification of slow and non-moving inventory.
- Use real-time metrics and analysis tools like ABC, FSN, and SDE(Scarce, Difficult and Easy).
- Plan for seasonal variations and adjust inventory levels accordingly.
- Integrate Management and Merchandising:
- Utilize advanced merchandising strategies for better demand forecasting.
- Integrate inventory management and advanced merchandising for optimization.
- Implement vendor-managed inventory systems for robust management.
- Optimize Marketing Tactics:
- Align inventory, merchandising, and promotions to offer suitable products.
- Use effective promotional strategies for retail profit or loss assessment.
- Employ targeted marketing campaigns to showcase and promote non-moving products.
- Eliminate Idle Stock Efficiently:
- Implement targeted promotions and margin optimization to clear slow-moving items.
- Utilize advanced product sorting for optimal placement in-store.
- Integrate product recommendation engines for enhanced inventory exposure.
- Impeccable Inventory Management System:
- Use methods like First-In-First-Out (FIFO) to prevent stock from staying long.
- Implement a systematic inventory ordering, tracking, sorting, storing, and consumption system.
- Categorize stocks into Fast-moving, Slow-moving, and Non-moving inventory.
- Regularly analyze inventory turnover ratios to identify stagnant items and take corrective measures.
Implementing these strategies ensures a streamlined supply chain, efficient inventory management, and maximized profits.
Difference Between Non-Moving And Slow-Moving Inventory
The non-moving and slow-moving inventories are the components of FSN inventory analysis. Both require efficient inventory management to optimize stock levels. However, they differ as follows:
| Basis | Non-Moving Inventory | Slow Moving Inventory |
|---|---|---|
| Definition | Inventory items that remain unsold for an extended period often indicative of low demand or potential obsolescence | Stock items are experiencing sales at a slower rate than anticipated, signaling the need for careful monitoring. |
| Sales Speed | This signifies a lack of sales activity over an extended timeframe | Involves ongoing sales but at a pace slower than initially expected |
| Identification | Any item with a 10% or below cumulative consumption rate and 70% or below cumulative average stay | Any item with a 20% or below cumulative consumption rate and 20% or below cumulative average stay |
| Risk Factors | Tied up capital and obsolescence | Overstocking |
| Demand Assessment | Lack of demand for specific items | Suggests existing demand, prompting a need for adjustments to align with market expectations |
| Cash Flow Impact | Ties up capital with minimal or no return | It affects cash flow, although at a slower rate, as revenue continues to be generated. |
| Adaptability | This may necessitate more drastic measures, such as liquidation or write-offs. | Allows for adaptive strategies, such as marketing improvements, to enhance sales |
Disclosure: This article contains affiliate links. If you sign up through these links, we may earn a small commission at no extra cost to you.

Frequently Asked Questions (FAQs)
Liquidating non-moving inventory involves strategic steps, such as offering discounts, bundling products, or running targeted promotions. Collaborate with resellers, explore online marketplaces, or consider charitable donations. Regularly reassess pricing strategies and leverage digital platforms to reach a broader audience. Employing creative marketing and pricing approaches can help recover some value and free up storage space.
The key distinction lies in sales speed. Slow-moving inventory indicates ongoing sales but at a slower rate than expected, requiring careful monitoring. Conversely, non-moving inventory remains unsold for an extended period, often signaling low demand or potential obsolescence. The identification criteria, risk factors, and adaptability strategies also vary.
Non-moving inventory poses significant risks, tying up capital with minimal returns and increasing the likelihood of obsolescence. Holding costs escalate, impacting cash flow. The lack of demand for specific items can lead to financial losses, while the stagnant stock may hinder adaptability. Effective strategies, including timely liquidation or write-offs, are essential to mitigate these risks and optimize inventory management.
Recommended Articles
This article has been a guide to what is Non-Moving Inventory. We explain its examples, how to identify & reduce it, & differences with slow-moving inventory. You may also find some useful articles here -
