Table Of Contents
What Is Negatively Skewed Distribution?
Negatively skewed distribution refers to the distribution type where more values plot on the graph's right side, the tail of the distribution is longer on the left side, and the mean is lower than the median and mode. It might be zero or negative due to the data being distributed negatively.
In finance, skewed distribution is used to evaluate the return on the investment. Therefore, negatively skewed data signifies a lower return on investment. Hence, the investor finds it risky to invest in countries where the income is negatively skewed due to long-term losses and currency fluctuation in the international market. However, those investors who look for short-term benefits can invest in negatively skewed distributed countries.
Key Takeaways
- A negatively skewed distribution is characterized by more values clustering towards the right side of the graph, with a longer tail on the left side. The mean is lower than both the median and mode.
- Negatively skewed data can have a value of zero or a negative value, indicating the extent of the negative skewness in the distribution.
- Normally distributed data exhibits equal mean, median, and mode values, indicating a balanced distribution of income and wealth, often reflecting positive government efforts and economic development.
Negatively Skewed Distribution Explained
A negetively skewed distribution, also sometimes referred to as the left-skewed form of distribution, is a statistical concept, which describes the shape of a probability distribution. In it, the data of the probability is concentrated towards the right side and extends more to the left side. Thus, the tail of the diagram appears to be longer and stretched more towards the left as compared to the right.
While visualizing this kind of a curve as in negatively skewed distribution histogram, we see that the tail on the left side is longer and there is a peak that is closer to the right side of the distribution. The data on the right side are more concentrated compared to the left.
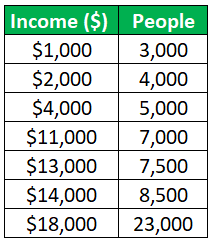
It shows a wide gap as the negative side is heavy. For example, the data below contains income distribution. The income of the rich class is much higher than the lower and middle class, so there is a wide gap in the income distribution which means it will be above average due to the high gap. In a negatively skewed distribution, the left tail is longer in the graph.
It shows unfavorable conditions for any nation, which means there is vast inequality in the distribution of income, which might result in the underdevelopment of the nation at large. Poverty, unemployment, etc., increase. In such a situation, the poor get poorer, and the richer get richer.
Therefore, understanding the skewness of a data distribution is an important part of statistical analysis and data interpretation. It acts as a guide for analysts and researchers who use this data pattern to make informed decisions based in the characteristics of the data set.
Curve
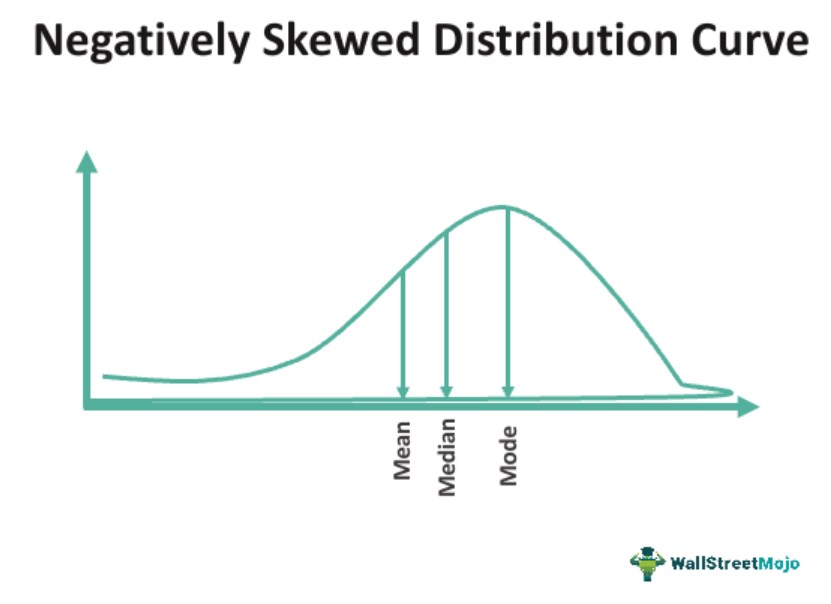
Let us understand the shape of the curve in case the data set is negatively skewed. We firstly note that there is no symmetry in the distribution. So the skewness refers to the asymmetry present in the negatively skewed distribution histogram. The shape of the curve is tilted towards the left with a long tail on the left side and the mode is close to the right.
The mode is more than the mean and the median. On the left side, there are very few values. Thus, the frequency gradually declines as we move towards the left side of the peak.
Examples
Let us consider the following examples to understand the calculation of a negatively skewed frequency distribution:
Example #1
The negatively skewed distribution for the dataset given above has been cited below. Let us have a look at it:
As shown in the above example, there is a wide gap in the income distribution, and the tail is bent more toward the left side of the plotting area, which reflects the distribution is negatively skewed distribution formula.
Mean = (Sum of all the number in the Data) / n
Where n is the number of samples
- = $1,000 + $2,000 + $4,000 + $11,000 + $13,000 + $14,000 + $18,000 / 7
- = $63,000/7
- = $9,000
Median Value = (n+1)/2 Value
- = (7 + 1 / 2) Value
- = 4th Value
- = $11,000
Mode = Highest Value = $18,000
As can be seen here, Mode > Median > Mean, i.e., $18,000 > $11,000 > $9,000
Example #2
Some real-life instances where of a negatively skewed frequency distribution seems evident are as follows:
- In cricket, some players scored lower than the average. Some get out on zero, some score very low runs, and only one or two players make the highest scores, which might result in the team's winning. Still, the distribution is negatively skewed if we see the scores player-wise.
- Another example is university exams. The exams are the same, but a few scoreless, a few score average, and a few score a high percentage, which shows the data are negatively skewed.
- In the USA, most people belong to the average income group, and very few belong to the high-income group. Therefore, it shows there is an unequal distribution of income. Hence, the data is negatively skewed.
- The human life cycle is also an example of negatively skewed distribution as many live the average life, some live very less, and some live a very high life in age.
- The taxation regime of underdeveloped countries and developing countries also show this type of distribution as most people pay the average or low-income tax. In contrast, only a few people pay very high-income taxes. It is due to the unequal distribution of income and wealth.
The above examples clearly explain the concept and the various situations where is it widely used for interpretation and forecasting.
Interpretation
Users must be aware of how to decode or interpret the results obtained as part of the negatively skewed distribution computation:
- It shows that there is a wide gap between the earnings.
- It shows the underdevelopment of the economy.
- It reflects the poor population of the country.
- It shows the failure of governmental measures on the distribution of income.
- It shows a fault in governmental policies.
- A negatively skewed distribution formula can be used to calculate and reflects the slow growth of the country.
- It reflects the exploitation of labor or the availability of cheap labor. Hence, the government must take measures to provide rights to the laborers.
- It shows the volatile nature of the market.
- It is a sign of weak domestic currency.
- It reflects the losses to the investors hence discouragement of the investment.
Thus, the above points help us in negatively skewed distribution interpretation, which are extremely useful in various fields.
Central Tendency of Negatively Skewed Distribution
Central tendency refers to the distribution's mean, median, and mode. For the normally skewed data, the mean, median, and mode are equal, which shows the equal distribution of income and wealth and the positive role of government efforts and the development of the economy.
In a positively skewed distribution, the country has favorable conditions as a large population belongs to the same group, and very few populations differ from the crowd. For a positively skewed distribution, mean, median, and mode are positives. In this case, the mean is greater than the median, and the median is greater than the mode.
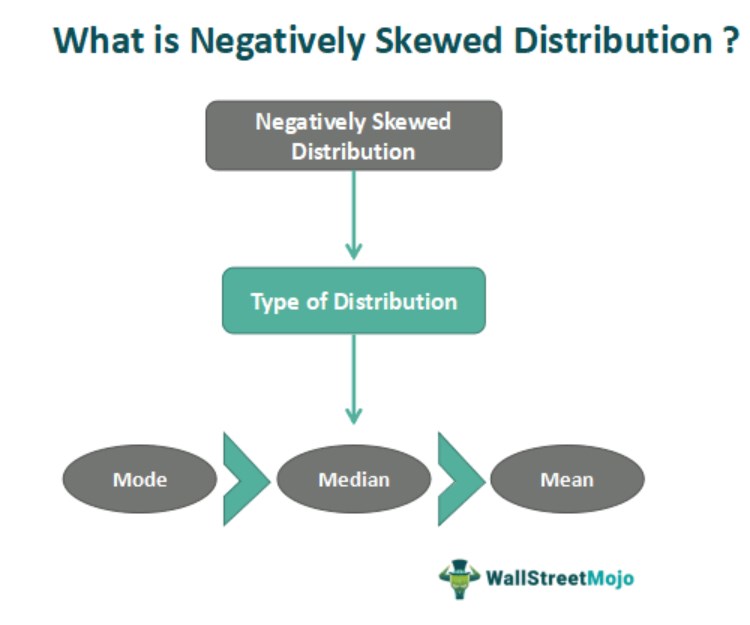
Whereas in negatively skewed distribution, data shows the unequal distribution, the central tendency shows as under:
Mode > Median > Mean
The median is the middle value, and the mode is the highest. But, due to unequal distribution, the median will be higher than the mean.
Negatively Skewed Distribution Vs Positively Skewed Distribution
Both the above are the two types of asymmetrical distribution that portrays two different kinds of shapes and their features. Let us find the differences between them.
- Regarding the shape, in case of negative skewness, the tail is stretched more on the left side unlike a positive skewness in which the tail is stretched towards the right.
- For the former, the main bulk of the data is found on the right side, whereas for the latter, the data bulk is towards the left side.
- For the negative skewness, the mode or the distribution’s peak is close to the right side, but for positive skewness, the mode is closer to the left.
- For the former, the mean is lower than the median, which is lower than the mode. But for the latter, the situation is just the opposite, where the mode is lower than the median, which is lower than the mean.
- In case of the negative skewness, the distribution tends to have the presence of outliers or extreme values on the left pulling the mean to the left and the opposite happens in case of positive skewness.
Thus, it is essential to understand the differences between the two kinds of distributions and the positively and negatively skewed distribution interpretation in statistics and data analysis to apply them in appropriate situations for obtaining suitable results.
