Table Of Contents
What Is Momentum Trading?
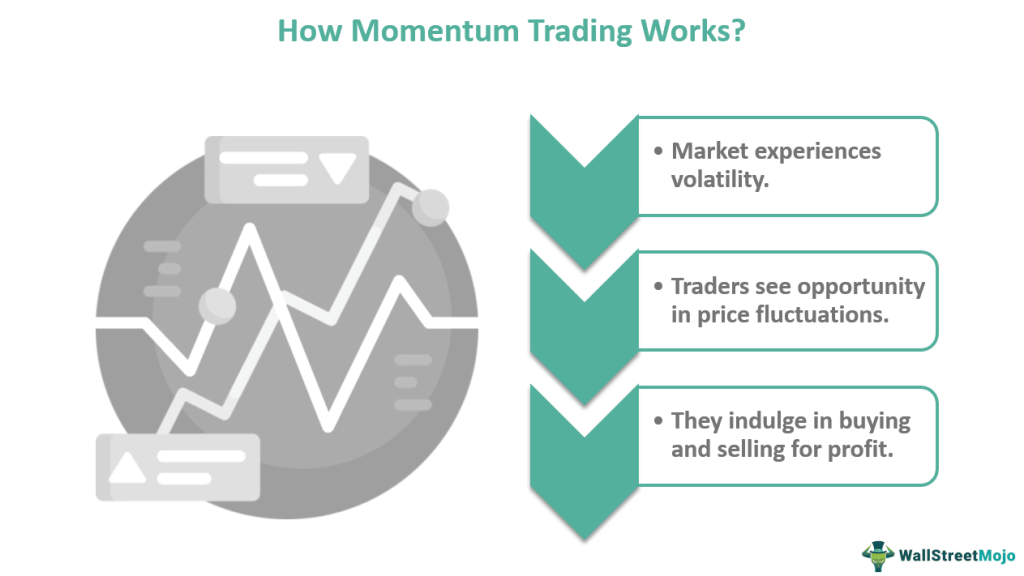
Momentum trading is a trading technique that takes advantage of market volatility by taking short-term positions in assets that are rising and selling them as soon as they start to fall. The money is then transferred to a new position. It is a highly profitable means of trading.

Stocks are traded in hopes that the momentum will continue and help investors make a lot of money from positions that might be a week or month old. When the returns are high, the risk involved is also high. Traders are at high risk if they time their purchases incorrectly and may lose money.
Table of contents
- What Is Momentum Trading?
- A momentum trading strategy is operated when the trader buys an asset that shows a major price or volume change, thus increasing their chance of profit.
- There are two types of momentum trading: relative momentum and absolute momentum.
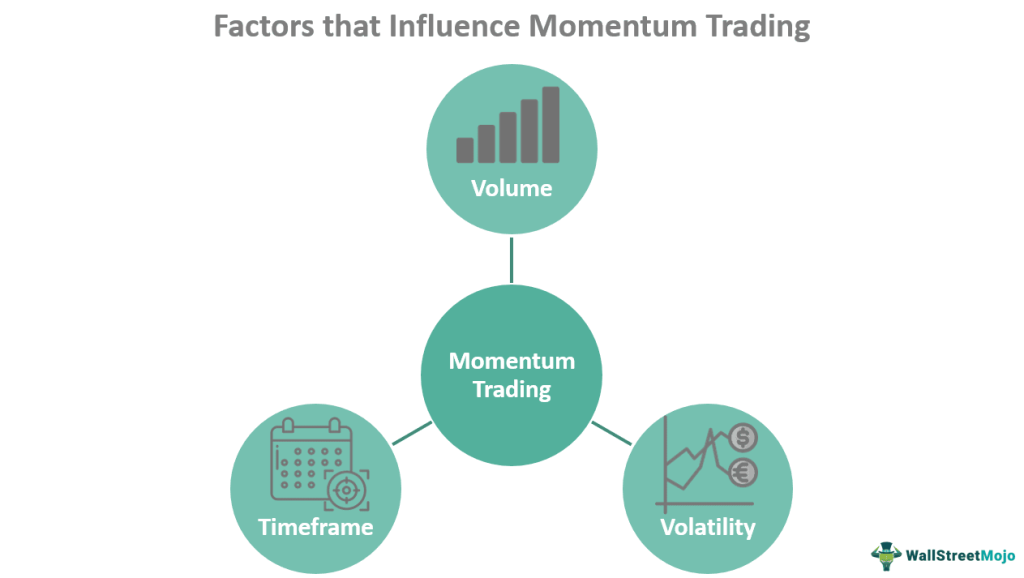
- Volume, volatility, and time frame are three important factors that influence momentum trading.
- Technical indicators are frequently used to measure how quickly the price of a particular asset fluctuates. They include the Indicator of Relative Strength (RSI), Moving Average Convergence Divergence (MACD), Average Directional Index (ADX), Rate of Change (ROC), and Stochastic Oscillators.
Momentum Trading Explained
A momentum trading strategy is where the trader buys an asset that shows a major change in price or volume. The investor purchases it when there is a clear upward trend or rises in the price of the stock or asset. They trade to profit from the inflated price movement in the direction of the dominant trend. It is frequently compared to patterns in more conventional financial markets like currencies, bonds, and commodities.
Types
There are two types of momentum trading: relative momentum and absolute momentum.
#1 - Relative Momentum
Here the performance of various securities within a single asset class is compared; investors use the relative momentum technique to determine which stocks to buy and which to sell. In a relative momentum approach, investors favor buying well-performing assets and selling poorly performing securities by comparing the performance of several securities within a given asset class.
#2 - Absolute Momentum
Strategies for trading by absolute momentum are used often. In an absolute momentum approach, a security's price behavior is compared to its performance in its past time series. Momentum can be assessed over longer time frames, such as weeks or months, and in day trading time ranges, such as minutes or hours.
Factors
Three important factors can influence momentum trading - Volume, Volatility, and Time frame.

- Volume: Volume is the number of assets traded. Volume is essential for momentum traders since they must be able to enter and exit positions quickly. This is because trade and profit depend on a constant market flow of sellers and buyers.
- Volatility: Volatility measures how much an asset's price changes. A market with high volatility experiences significant price swings, whereas one with low volatility is more stable. To profit from temporary increases and decreases in the value of an asset, momentum traders will look for volatile markets.
- Time frame: Short-term market changes are the primary focus of momentum trading techniques. However, the trade length may vary according to how long the trend persists in its current strength. This might make it appropriate for traders who favor shorter-term strategies like intraday momentum trading strategy, day trading, and scalping and those who use longer-term strategies like position trading.
Indicators
Technical indicators, known as momentum indicators, are frequently used to measure how quickly the price of a particular asset fluctuates. These indicators aid in the comprehension of the magnitude of price changes. The critical point for traders to remember is that these indicators work best when the market is gaining rather than falling.
#1 - Indicator Of Relative Strength (RSI)
It is an oscillator that measures price fluctuations and the speed at which they occur. It oscillates between the values of 0 and 100. Market participants can identify signals by looking for divergences and irrational movements. RSI helps determine whether an upswing or downtrend is present. In general, RSI signals the ideal moment to sell and turn a profit if it exhibits overbuying behavior. Similarly, when RSI displays overselling indications, it hints that it is time to buy. It can be helpful to plan an intraday momentum trading strategy.
#2 - Moving Average Convergence Divergence (MACD)
MACD is frequently regarded as the best momentum indicator. It shows the relationship between two moving averages of the price of an instrument. Momentum is recorded when the MACD alternates between moving averages.
#3 -Average Directional Index (ADX)
Its main purpose is to determine how strong a trend is. Upward and downward trends can be known through Positive Directional Indicator (+DI) and the Negative Directional Indicator (-NDI). As a result, ADX often consists of 2 distinct lines that indicate to traders the trend.
#4 - Rate Of Change (ROC)
The momentum oscillator, the ROC, fluctuates between above and below zero values. Here, prices from one time period are compared with the current prices. A big price increase is indicated when the ROC travels upward, while a downward movement shows a significant price decrease.
#5 - Stochastic Oscillator
Traders and investors utilize this momentum-based tool to compare and contrast the closing prices of an asset over a predetermined period. It tracks the market's momentum and speed and helps forecast price movements. However, volume and price should be taken into account by it.
How To Do?
The concept of momentum trading is based on the idea that strong stocks will keep rising or falling in value while weak stocks will keep falling. To profit on price increases, momentum traders acquire moving stocks and sell short-term supplies at a loss. Typically, traders decide which direction the trend will be in before trading. They then try to find a point of entry to buy (or sell) the assets they possess using one of the many available momentum indicators.
The traders will then choose a good and logical exit time based on anticipated and previously noted market support and resistance levels.
Additionally, depending on the direction of the trade, stop-loss orders shall be placed above or below the trade entry point. This is a step to protect against the potential for an unexpected price trend reversal and unwanted losses.
Momentum trading strategy can be of:
Short-term momentum: this approach searches for price patterns or trends over the short term. This trading strategy can be utilized in any market setting and time frame chart. Day traders, who close out all their deals at the end of the day, are short-term momentum traders.
Longer-term momentum: this strategy requires daily, weekly, and monthly charts to focus on longer-term momentum. Longer-term momentum traders look for long-term up-and-down trends and individual securities. Using longer time frames can reduce the focus on volatility present in shorter periods.
Chart
Chart
Let us look at the following relative strength index chart to understand how traders can engage in momentum trading to make financial gains in the market.

In the above relative strength index chart, the purple line below the candlesticks denotes the RSI values. Conventionally, the RSI oscillates between 0 and 100. When the value is above 70, it signals overbought conditions. That said, when the RSI value is below 70, it is an indication of oversold conditions in the market.
Per the chart, there was significant selling pressure around 7:30 am on August 17, 2023. At that level, the RSI value dropped below 30, indicating oversold conditions. If traders considered that signal and entered a short position, they could have earned significant profits as the price went into a downtrend.
For more such momentum trading charts that can help traders understand how they can earn gains in the market, individuals may go to the official platform of TradingView.
Examples
Check out these examples to gain a better idea of momentum trading:
Example #1
Danny bought a stock at $10. Soon after his purchase, the market experienced volatility and fluctuated within the values of $12, $13, and $14. He set a limit of $15 and sold the asset when its value reached that level. The $5 increase is equal to 50% profit.
Example #2
David tracked three assets: "A," "B," and "C." They showed average changes of 25%, 30%, and 45% over the week. Since asset "C" gave a high percentage of change, he indulged in momentum trading with it to make profits.
Momentum Trading vs Swing Trading
Here are the key differences between momentum and swing trading:
| Key differences | Momentum trading | Swing trading |
|---|---|---|
| Meaning | Momentum traders aim to enter during an uptrend and exit before a downtrend by monitoring overall price patterns. These trades can last for a few months. | Swing trading only sometimes adheres to the broad price trend of a stock. Traders may engage in swing trading if there are significant fluctuations. |
| Frequency of trade | Momentum followers trade less frequently since their trades result in greater profits. | The objective of a swing trader is to profit from short fluctuations in the price of a stock. This implies that they quickly enter and exit their locations. |
| Market Timing | They can invest early and with less risk because they follow the larger general trend of a stock's price movement. They can wait for a trend to be confirmed or watch for a countertrend. | Alternatively, swing traders will seize the opportunity when volume and momentum indicators reveal a positive price trend. Since swing traders are just riding a short-term movement, timing is more important. |
For professional-grade stock and crypto charts, we recommend TradingView – one of the most trusted platforms among traders.
Disclosure: This article contains affiliate links. If you sign up through these links, we may earn a small commission at no extra cost to you.
Frequently Asked Questions (FAQs)
One element traders must consider before picking a stock is the time frame. The period within which the investor wants to profit is important, along with the reason behind the volatility, whether it is short-lived or not, and whether it can be profitable, among other things.
The value of momentum indicators is calculated by dividing the current closing price by the price from a previous period and multiplying the quotient by 100. Therefore it can be represented as an (asset's current closing price ÷ closing price from the previous period) x 100.
It can be profitable. It is time intensive and often works on "buying high and selling higher." This may work best in a bull market and have a high fee. Therefore it depends on the trader and timing.
Recommended Articles
This has been a guide to what is Momentum Trading. We explain its indicators, how to do it, and comparison with swing trading. You can learn more about trading from the following articles –

