Table Of Contents
Key Takeaways
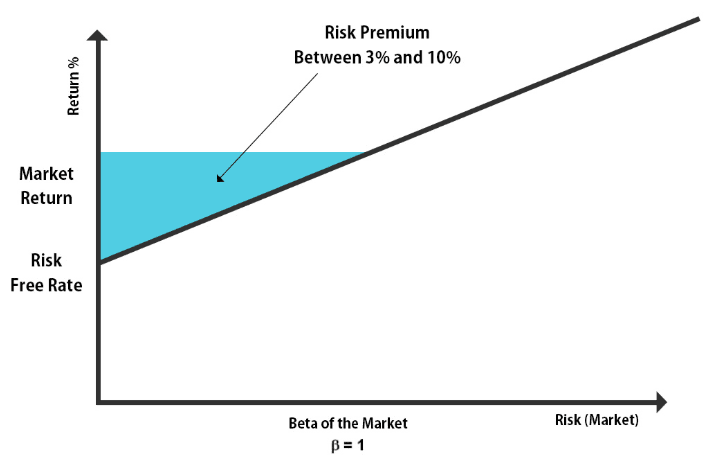
- The market risk premium is based on the CAPM model, and due to the increased risk in the portfolio, there is an additional return called the market risk premium.
- The market risk premium is the difference between the expected return from an investment and the risk-free rate.
- The expected return and the risk-free rate, which comprise the market risk premium model's two main components, depend on the erratic market dynamics. It makes the model an expectation model.
- One of the major pitfalls of this model is its inaccuracy, as it is a prediction model, depending on market conditions and past analysis.
Formula
The Market risk premium formula is simple, but there are components we need to discuss.
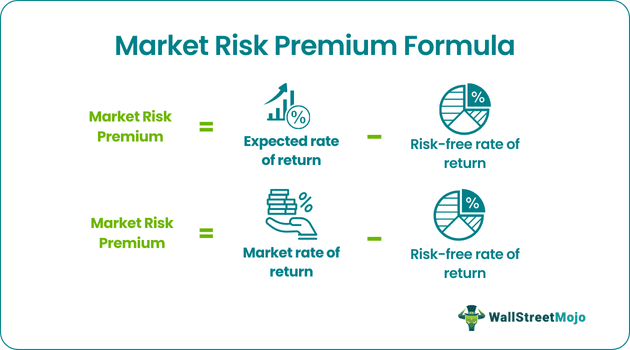
Market Risk Premium Formula = Expected Return – Risk-Free Rate.

Now, let’s take each of the market risk premium formula components and analyze them.
First, let’s think about the expected return. But, of course, this expected return is dependent on how an investor thinks. And what is the type of investments he invests in?
There are the following options that we can consider from the point of view of the investors –
- Risk-tolerant investors: If the investors are players in the market, understand the ups and downs, and are okay with whatever risks they need to go through, we will call them risk-tolerant investors. Risk-tolerant investors won’t expect much from their investments, and thus, the premiums would be much lesser than the risk-averse investors.
- Risk-averse investors: These investors are usually new and have not invested much in risky investments. They have saved their money in fixed deposits or savings bank accounts. And after thinking over the prospects of investment, they start to invest in stocks. And thus, they expect much more return than risk-tolerant investors. So, the premium is higher in the case of risk-averse investors.
The premium also depends on the type of investments the investors are ready to invest in. If the investments are too risky, the expected return would be much more than the less risky investments. And thus, the premium would also be more than the less risky investments.
We also need to consider two other aspects here while calculating the premium.
- Required Market Risk Premium: This is the difference between the minimum rate the investors may expect from any investment and the risk-free rate.
- Historical Market Risk Premium: This is the difference between the historical market rate of a particular market, e.g., NYSE (New York Stock Exchange), and the risk-free rate.
Interpretation
- The market risk premium model is an expectancy model because both of its components (expected return and risk-free rate) are subject to change and depend on the volatile market forces.)
- To understand it well, you need to have the basis of computing the expected return to find the figure for market premium. And the basis you choose should be relevant and aligned with the investments you have made.
- In normal situations, all you need to do is go for the historical averages to use as your basis. If you invest in NYSE and want to calculate market risk premium, all you need to do is find out the records of the stocks you have decided to invest in. And then find out the averages. Then you would get a figure that you can bank upon. It would be best to remember that by taking historical figures as the basis, you are assuming that the future will be exactly like the past, which may turn out to be flawed.
What would be the right market risk premium calculation, which would not be flawed and aligned with the current market condition? We need to look for Real Market Premium then. Here’s the Real Market Risk Premium formula –
Real Market Risk Premium = (1 + Nominal Rate / 1 + Inflation Rate) – 1
In the example section, we will understand everything in detail.
According to Economists, if you want to base your decision on the historical figures, you should go for a long-term perspective. Because the premium is beyond 6%, it is way beyond the actual figures. That means if you take a long-term perspective, it will help you find out an average premium closer to the actual one. For example, if we look at the average premium of the USA from 1802 to 2008, we would see that the average premium is a mere 5.2%. That proves a point. If you want to invest in a market, look at the historical figures for more than 100 years or as many years as you can and then decide upon your expected return.
Calculation with Example
Let’s get started with a simple one, and afterward, we will go to complex ones.
Example # 1 (Market Risk Premium Calculation)
Let’s have a look at the details below -
| In Percentage | Investment 1 | Investment 2 |
|---|---|---|
| Expected Return | 10% | 11% |
| Risk-free rate | 4% | 4% |
In this example, we have two investments, and we have also been provided with the information for the expected return and the risk-free rate.
Now, let’s look at the market risk premium calculation
| In Percentage | Investment 1 | Investment 2 |
|---|---|---|
| Expected Return | 10% | 11% |
| (-) Risk-free rate | 4% | 4% |
| Premium | 6% | 7% |
In most cases, we need to base our assumptions on the expected return on historical figures. That means whatever the investors expect as a return would decide the premium rate.
Let’s have a look at the second example.
Example # 2 (Equity Risk Premium Calculation)
Market Risk Premium and Equity Risk Premium are different in scope and conceptually, but let’s look at the equity risk premium example, as well as equity, which can be considered one type of investment.
| In Percentage | Investment |
|---|---|
| Large Company Stocks | 11.7% |
| US Treasury Bills | 3.8% |
| Inflation | 3.1% |
Now, let’s have a look at the equity risk premium. The equity risk premium is the difference between the expected return from the particular equity and the risk-free rate. Here let’s say that the investors expect to earn 11.7% from large company stock and the rate of the US Treasury Bill is 3.8%.
That means the premium for equity risk would be as follows –
| In Percentage | Investment |
|---|---|
| Large Company Stocks | 11.7% |
| (-) US Treasury Bills | 3.8% |
| Equity Risk Premium | 7.9% |
But what about inflation? What would we do with the inflation rate? We will look at that in the next real market risk premium example.
Example # 3 (Real Market Risk Premium Calculation)
| In Percentage | Investment |
|---|---|
| Large Company Stocks | 11.7% |
| US Treasury Bills | 3.8% |
| Inflation | 3.1% |
Now we all know that it is the expectancy model, and when we need to calculate it, we need to take historical figures in the same market or for the same investments to get an idea of what to perceive as expected return. There lies the importance of real premium. We will take into account inflation and then compute the real premium.
Here’s the real market risk premium formula –
(1 + Nominal Rate / 1 + Inflation Rate) – 1
First, we need to compute the nominal rate, i.e., normal premium –
| In Percentage | Investment |
|---|---|
| Large Company Stocks | 11.7% |
| (-) US Treasury Bills | 3.8% |
| Premium | 7.9% |
Now we will take this premium as a nominal rate and find out the real market risk premium.
Real Premium = (1 +0.079 / 1 + 0.031) – 1 = 0.0466 = 4.66%.
It is useful because of two particular reasons –
- First, the real market premium is more practical from inflation and real-life data.
- Second, there is little chance of expectation failure when investors expect something like 4.66%-6% as expected return.


