Table Of Contents
What Is Marginal Revenue Formula?
The marginal revenue formula is a financial ratio that calculates the change in overall revenue resulting from the sale of additional products or units. It usually is seen following the law of diminishing returns and slows down with output levels increasing. It is commonly seen represented through a downward-sloping graph.

Any organization wanting to maximize its net profits would ideally want to raise its marginal revenue in such a way that its marginal costs are equal. When the marginal revenue formula economics show a dip above their marginal costs, they would ideally stop production as selling a unit would incur more costs than the revenue that would be generated.
Key Takeaways
- The marginal revenue formula is a financial ratio measuring the change in total revenue from the additional products or units sold. It affects product price and production level depending on the industry.
- It is a microeconomic term. In addition, it also has various financial and managerial accounting applications.
- In an actual competition environment, a manufacturer creates a considerable quantity and sells the product at market price. If the manufacturer prices, more sale decreases in a competitive market, and substitutes are available.
- The production influences the selling price if a specific industry’s output is low and choices are unavailable.
Marginal Revenue Formula Explained
The marginal revenue formula helps companies understand the revenue shifts for every product or unit sold additionally.
To understand this concept, it is important to first reiterate the fact that the revenue generated by an organization is heavily based on the demand and supply within their target market and the overall movement in the market. Therefore, their overall marginal revenue would depend on how many units they have managed to already sell.
Marginal revenue economics is used for various purposes by companies such as understanding their historical data with this regard to predict consumer behavior and produce goods in accordance with the forecasted demand.
Moreover, it can also be an apt economic metric for setting efficient prices that not only bring significant revenue for the company but also from the attraction of customers’ points of view.
Revenue vs Income Explained in Video
Formula
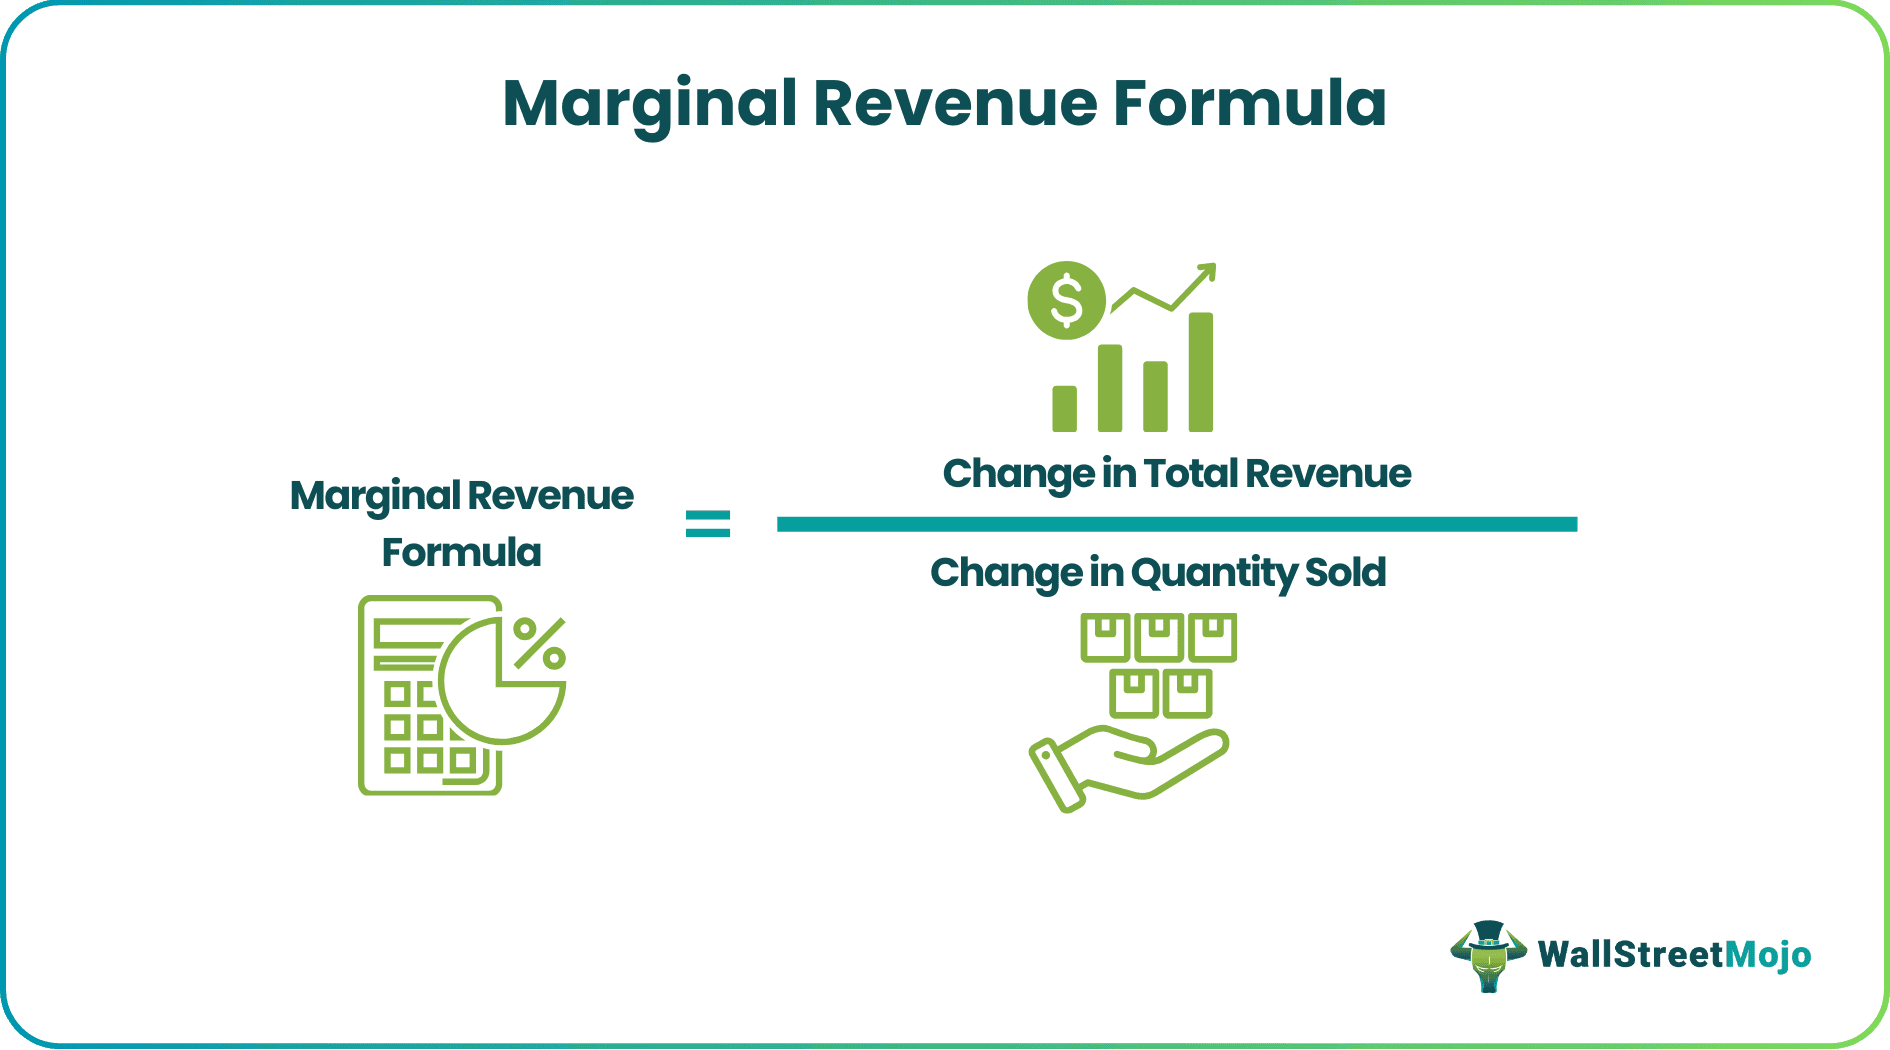
Marginal Revenue Formula = Change in Total Revenue / Change in Quantity Sold
How To Calculate?
The marginal revenue formula is calculated by dividing the change in total revenue by the change in quantity sold. Based on this, let us keep the following steps in mind to calculate this facet of business.
Below are the steps for the calculation of marginal revenue:
- First, we need to calculate the change in revenue. A change in revenue is a difference in total revenue and revenue figures before the additional unit.
Change in Total Revenue = Total Revenue – Revenue figure before the additional unit sold
- Then, we will calculate the change in quantity. Change in quantity is the total additional quantity. Marginal revenue is used to measure the changes in producing one other unit.
Change in Quantity Sold = Total quantity sold – Quantity figure before the additional unit
So, a change in quantity is the total quantity sold subtracted by the normal quantity or quantity figure before the additional unit.
Also, note the relationship between Marginal Revenue (MR) with Marginal Cost (MC).
If MR u003eMC, then the company should increase output for more profits. If MRu003c MC, then the company should decrease output for additional profit. Under perfect competition, if the company objective is maximizing profit, then MR=MC.
Examples
Let us understand the concept in depth by using a few practical examples and further simplifying it through an Excel template that can be downloaded.
Example #1
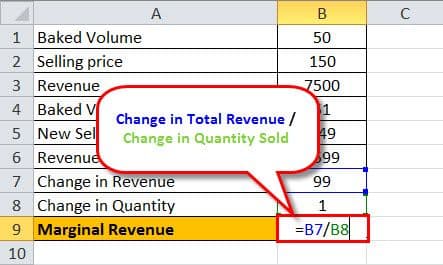
Mary owns a bakery and prepares cakes. Mary wants to know how much to produce and sell the price of the cakes. She used a marginal revenue curve to find the same. Mary bakes 50 cakes per day and sells the same at $150. As a result, she generates $7,500 in revenue. After her analysis, she needs to price cakes from $150 to $149; she bakes 100 cakes. Now, let us see the calculation of marginal revenue with one extra unit of cake baked by Mary.

First, we calculate the change in revenue by multiplying the baked volume by a new price and then subtracting the original revenue. And a change in quantity is one.
- Change in Total Revenue = (149 * 51) – (150 * 50)
- = 7599 - 7500 = 99
Marginal Revenue Calculation = Change in Total Revenue / Change in Quantity Sold

So, the result will be-

Example #2
A chocolate seller prepares homemade chocolates and sells 30 packets per day, including the cost of chocolate raw material, preparation, packing, etc. The seller decides to sell the same for $10 for one packet of chocolate.
35 packets were made by mistake and sold at $10 each. They earned $350 on that particular day. Generally, they sell 30 packs and earn $300 from it. Today, they sold an additional five packets. Through this, they had marginal revenue of $30, i.e. ($10 * 5) which will be $50.
Significance
It is a microeconomic term. Still, it also has many financial and managerial accounting applications. Management uses marginal revenue to analyze the below points:
- To analyze consumer demand or demand for the product in the market - Misjudging customer demand leads to a shortage of products and loss of sales and production, which leads to excess manufacturing cost.
- Setting the price of the product - Setting the price is one way to influence the production schedule and change demand. If the price is high, demand will reduce. If the price is high, the company can profit, but sales will reduce if competitors sell the same at a lower cost.
- Plan production schedules - Based on the demand of the product in a market plan for production schedules.
It greatly influences product price and production level based on industry. Practically, in an actual competition environment where a manufacturer produces a huge quantity and sells the product at market price, the marginal revenue is equal to the market price. If the manufacturer prices, more sales decrease as in a competitive environment, alternatives are available. Whereas production affects the selling price if the output is low from a particular industry and choices are not available.
Hence, less supply will increase demand and increase the willingness of a customer to pay a high price. As a result, the company keeps marginal revenue inside the constraint of the price elasticity curve but can adjust its output and cost to optimize its profitability.


