Table Of Contents
Mann-Whitney U Test Definition
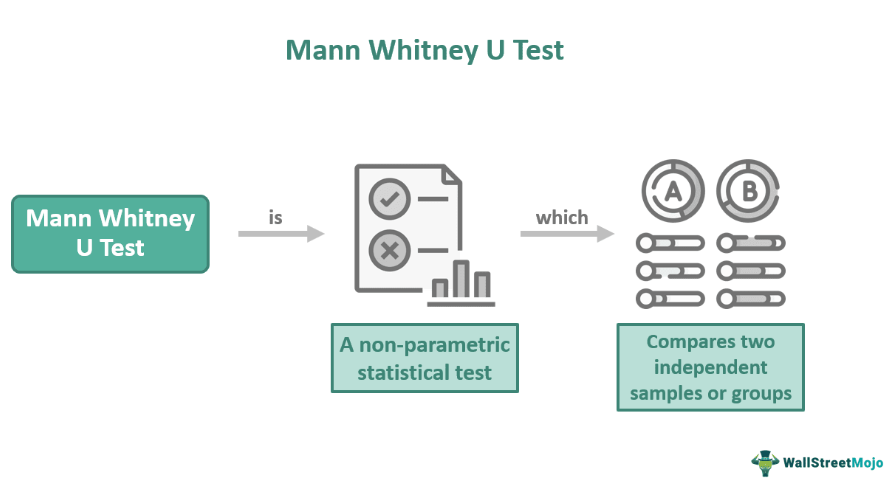
The Mann-Whitney U test is a non-parametric statistical test that compares the distribution of two independent samples or groups. This test aims to determine if there is a significant difference between the distributions of two separate groups. It helps identify if one group tends to have higher or lower values than the other group by comparing the ranks of the observations.
This test is an alternative to the independent samples t-test when the assumptions of normality and equal variances are not met. It is valuable for working with ordinal or non-normally distributed data and is commonly applicable in several fields, including social sciences, biology, and medicine.
Key Takeaways
- The Mann-Whitney U Test is a non-parametric statistical test designed to compare the distribution between two independent samples or groups. It assists in determining if there is a significant difference between the distribution of the two groups.
- This test compares the differences in the distributions by ranking them. However, it does not offer any information on the magnitude or directions of the differences.
- It is widely accepted in various domains like social sciences, medicine, biology, and engineering.
Mann-Whitney U Explained
The Mann-Whitney U test is also known as the Wilcoxon rank-sum and the Wilcoxon Mann-Whitney tests. It is a non-parametric statistical test that can compare the distributions of two independent groups or samples. It is usually employed when the data do not meet the assumptions of normality or equal variances required in parametric tests.
The test occurs by assigning ranks to the combined data from the two samples, irrespective of their original groups or labels. This test can compare the distributions based on ranks rather than specific values. Moreover, it does not provide any information about the direction or magnitude of the difference. It can only identify if one group tends to have higher or lower values than the other. However, the test is widely accepted in various fields, including social science, biology, medicine, and engineering. It is specifically designed for assessing ordinal or non-normally distributed data.
Assumptions
The Mann-Whitney U Test assumptions are as follows:
- The observations in each group are independent, implying that the values in one group should not be influenced by or related to the values in the other group in any way.
- The shape of the distributions for both groups is similar. This means that the groups should have similar patterns of variability or spread.
- The samples are drawn randomly from their respective populations.
- The test is suitable for ordinal or continuous data that can be ranked. However, it can also be applied to categorical data if the levels or categories have a meaningful order.
How To Do?
The steps for this test are:
- Step 1: State the null and alternative hypotheses.
- Step 2: Collect and organize the data from two independent samples or groups.
- Step 3: Combine the data from both groups and rank them in ascending order, ignoring the group labels. Assign the lowest rank 1 to the smallest value, the next rank 2 to the next smallest value, and so on. If there are ties with identical values, assign the average of the ranks to those observations.
- Step 4: Calculate the test statistic (U). Add the ranks separately for each group. The test statistic (U) is the smaller of the two sums.
- Step 5: Determine the critical value or p-value. Refer to the Mann-Whitney U distribution table to find the critical value corresponding to the sample sizes and chosen significance level.
- Step 6: Compare the test statistic to the critical value or p-value. If the calculated U statistic is lower than the critical value or the p-value is less than the chosen significance level, reject the null hypothesis. Do not reject the null hypothesis if the calculated U statistic is higher than the critical value or the p-value is more than the chosen significance level.
- Step 7: Interpret the results. If the null hypothesis is rejected, it suggests a significant difference between the distributions of the two groups. If the null hypothesis is not rejected, it indicates that there is no significant difference between the groups.
Examples
Let us discuss a few examples:
Example #1
Suppose Jim, a middle school teacher, wants to compare the heights of two groups of students. Group A comprises 20 male students, and Group B includes 15 female students. The null hypothesis is that the two groups have no significant difference in heights.
He collected the students' heights, combined the data, and ranked them. He calculated the U statistic and used a table to determine if the two groups had a significant height difference. This is an example of the Mann-Whitney U Test.
Example #2
Let us assume Kate is a high school teacher who wants to compare the test scores of the students in the 11th grade and the 12th grade. Group A consisted of 30 students from the 11th grade, and Group B consisted of 25 students from the 12th grade. The null hypothesis is that the two groups have no significant difference in test scores.
She noted the test scores of all the students and ranked the combined data. Then she calculated the U statistic and evaluated the critical value or p-value. This test helped Kate determine if there was a significant difference in test scores between Group A and Group B. This is an example of the Mann Whitney U Test.
Advantages And Disadvantages
Advantages
- The test does not assume a specific distribution for the data. It is robust against deviations from normality and can handle data with outliers or skewness. This makes it suitable for analyzing non-normally distributed or ordinal data.
- It can compare the distributions of two independent samples without requiring assumptions about their population parameters or equal variances.
- This test suits various data types, including continuous, ordinal, discrete, or categorical variables. It enables to examine the differences between groups based on ranks instead of specific values.
- It can effectively detect differences between groups, even with smaller sample sizes.
- The test results are easy to interpret. It offers evidence of whether there is a significant difference between the two groups and helps to determine which group tends to have higher or lower values.
Disadvantages
- This test is mainly designed for comparing the distributions of two independent samples or groups. It cannot directly compare more than two groups.
- Extremely imbalanced sample sizes can negatively impact the test's power as the test's ability to detect significant differences can get reduced.
- The test primarily relies on ranking the data while ignoring the actual values, which can result in a loss of information.
- It is a test for finding a difference between two samples or groups. It does not give information about the direction or specific nature of the difference.
- Since this test relies on ranking data, if the values are identical, it can result in ties that can create complexities and require additional adjustments.
Mann Whitney U Vs Kruskal Wallis Vs Kolmogorov-Smirnov Test
The differences are as follows:
- Mann Whitney U test: This non-parametric test can compare the distributions of two independent groups. It is appropriate for ordinal or non-normally distributed data. It ranks the observations and conducts examinations for significant differences.
- Kruskal Wallis Test: Kruskal Wallis Test is a non-parametric test that compares the distributions of three or more independent groups. It is beneficial for testing for a significant difference in ranks among the samples or groups.
- Kolmogorov-Smirnov test: This non-parametric test examines whether a sample follows a specific distribution. It compares observed and expected cumulative distribution functions. It is valuable for testing goodness-of-fit or comparing two distributions, assuming continuous data and complete distribution information exist.
Mann Whitney U Test vs T-Test
The differences are:
- Mann Whitney U test: It is a non-parametric test for comparing two independent groups, which is suitable for ordinal or non-normally distributed data. It ranks observations and compares distributions based on ranks instead of specific values. It does not assume equal variances or normality.
- T-test: This parametric test compares the means between two independent or paired groups. It assumes normality and equal variances and compares means or differences in means using the t-statistic. Furthermore, it can provide specific information about the magnitude and direction of the difference between the groups.
