Table Of Contents
What Is Longitudinal Data Analysis?
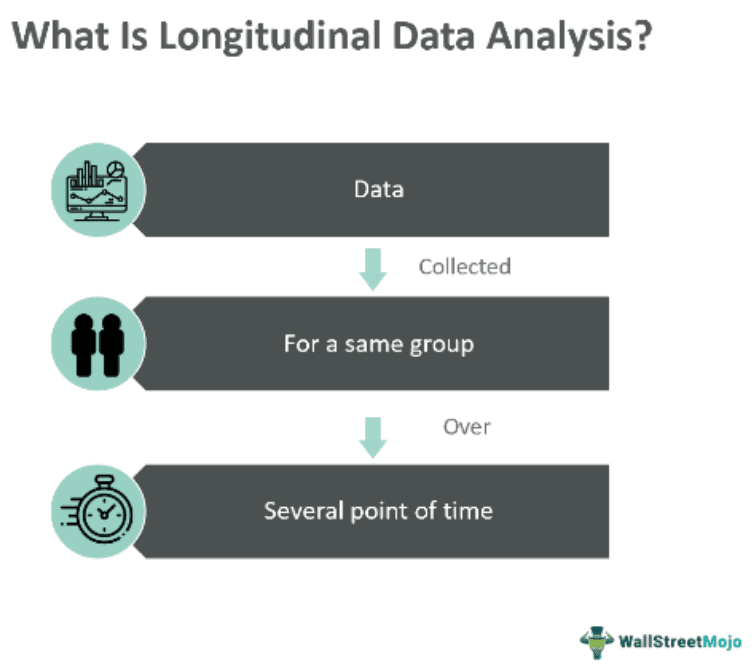
Longitudinal Data Analysis is a statistical tool or method used to examine financial data on the same group of units or individuals at several points over time. It consists of a brief sequence of repeated measurements made on the same analytical unit (individuals, for instance).

Longitudinal data is a type of data that has been measured repeatedly. From a statistical point of view, longitudinal analysis, especially in the financial world, is a helpful tool that allows investors and researchers to constantly examine the relationship between variables while controlling time- and human-specific effects.
Key Takeaways
- Longitudinal data analysis is a statistical tool or method used to examine data on the same group of units or individuals at several points over time.
- The main goal of data analysis, commonly referred to as growth curve analysis or growth modeling, is to measure change or trajectories.
- This method is superior to cross-sectional studies in estimating risk and reducing the possibility of a faulty classification.
- Also, it helps investors understand behavior by tracking the course of individual financial decision-making.
Longitudinal Data Analysis Explained
Longitudinal data analysis is the analysis of data that is collected at varied time points on the same unit (individuals). It allows for the prospective recording of health outcomes and measuring associated exposures. This method is superior to cross-sectional studies in estimating risk and reducing the possibility of a faulty classification. Moreover, it allows for the measurement of changes in outcomes within a single unit of analysis and can distinguish various types of time-dependent factors.
The main goal of data analysis, commonly referred to as growth curve analysis or growth modeling, is to measure change or trajectories. However, this analysis has two main goals: (a) determining how the outcome variable varies over time and (b) forecasting or explaining variations in these changes.
With the help of longitudinal data analysis methods, researchers can now fully comprehend how different factors influence financial outcomes over time, going beyond the limitations of cross-sectional analysis. In addition, this data analysis helps researchers fully understand how various factors influence financial outcomes over time, beyond cross-sectional analysis.
Examples
Below are a few examples to help you understand the concept better.
Example #1
Suppose Danny, an investor, examines stock market data over time using longitudinal analysis. She can spot possible investment opportunities and forecast future market movements. The analysis helped her make well-informed investment judgments based on the analysis of historical data by observing the longitudinal patterns and trends in stock prices. It will give her the information she needs to make informed decisions.
Example #2
A study was conducted as an application of stock instability. On December 13, 1996, a price-limit policy was implemented in the Chinese market with the purpose of limiting price volatility. Under these conditions, the price can fluctuate by up to 10% based on the prior day's close. Any quote beyond this range, known as stock daily limit-ups and limit-downs, is invalid.
After performing the longitudinal analysis of the daily stock limit-ups and -downs of 60 stocks from 49 seasons, this study concluded that the quarterly counts of daily limit-ups and limit-downs showed a positive correlation, further characterized by stock-specific random effects, reflecting stock instabilities.
Applications
There are various applications of applied longitudinal data analysis in many different fields. Some of them are as follows:
- Medical Field: To evaluate the efficacy of medicines, track the development of diseases, and look at the results of patients over time.
- Social Sciences: Examine how attitudes, behaviors, and socioeconomic variables change over time. The analysis makes it possible to analyze longitudinal data on economic variables in economics, including Gross Domestic Product (GDP) growth or employment rates.
- Marketing: Market researchers also use this analysis to comprehend customer preferences and behaviors across time.
- Finance Industry: Numerous fields, including financial econometrics, asset pricing, stock forecasting, risk management, and portfolio management, can benefit from this study while making important decisions.
Longitudinal Data Analysis vs Time Series Analysis
There are notable differences between the concepts. Some of them are as follows:
| Longitudinal Data Analysis | Time Series Analysis |
|---|---|
| The subjects’ outcomes and possibly treatments or exposures are measured at multiple follow-up times, and thus, their statistical analysis constitutes an analysis of intra- and inter-individual variation. | Its statistical analysis is an analysis of intra-individual variation because it deals with the sequential behavior study of a single subject (or any unitary entity). |
| The results of this method generalize across the population from which the sample of subjects was drawn. | Time series results do not generalize across some populations of subjects but instead generalize across the time domain. |
| In longitudinal analysis, we actually have the measurement of change at the individual level. | In a time series, we can measure the overall change in the measurement over time (or by group). |
