Table Of Contents
What Is A Long-Legged Doji?
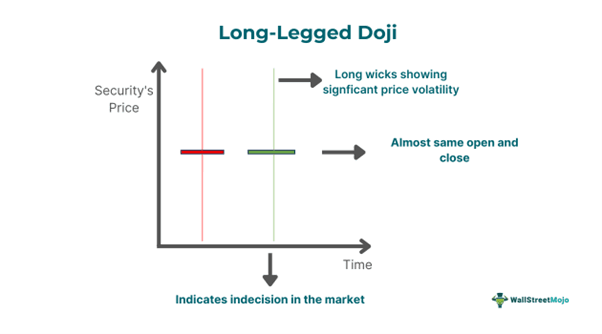
A Long-Legged Doji refers to a candlestick consisting of long lower and upper shadows and roughly the same opening and closing prices. Such a candle depicts significant price fluctuation during the trading session. It indicates indecision among market participants, which might lead to a price reversal.

The long wicks of such candles show active buying and selling. Nevertheless, neither bulls nor bears could gain complete control as the open and close were almost identical. Individuals can analyze such candlesticks when trading different types of financial instruments, like stocks, forex, cryptocurrency, etc., irrespective of the timeframe. Generally, these candles can be reliable near resistance and support levels.
Key Takeaways
- Long-legged doji meaning refers to a type of candlestick in technical analysis that has a very short body, representing almost equal opening and closing prices, in addition to elongated wicks on the vertical portions.
- This candlestick represents indecision and indicates a possible trend reversal in the market.
- A noteworthy disadvantage of this candlestick is that it often generates false signals and cannot serve as a standalone indicator.
- There are various benefits offered by such candlesticks. They provide insights into the market sentiment and can be used across various timeframes.
Long-Legged Doji Candlestick Explained
The long-legged doji candlestick meaning refers to a candle that occurs in a security’s price chart when the asset’s open and close are approximately identical, resulting in an extremely small body. The formation of such a candlestick represents an intricate balance between supply and demand, signaling a potential shift concerning the prevailing trend.
The candle formation may occur anytime during market hours. However, it is most noteworthy if it appears after a significant price movement. When a long-legged doji candle appears following a downtrend or an uptrend, it is a sign of a potential exhaustion of momentum. This, in turn, is an indication that a price reversal might be forthcoming.
The candlestick may also occur during consolidation periods when the security trades within a narrow range. In this case, the candlestick is a sign that the price is likely to break out of the trading range.
One must note that the frequency of such a candlestick’s formation depends on the timeframe under consideration and the market. That said, the formation of this candle is rare, generally speaking.
This candlestick’s color can be red or green. The former indicates a bearish sentiment, while the latter signals a bullish sentiment. Its color helps in better understanding the market situation. As in the case of other candles, the opening and closing prices determine the color. In the case of a red or black candlestick, the closing price is below the open. On the other hand, in the case of a green or white candlestick, the close is above the open.
Formation
As noted above, the formation of this candle happens when the opening and closing prices are roughly identical, thus establishing a small body. The upper and lower wicks are significantly longer in comparison to the body, thus representing noteworthy price movement during the period.

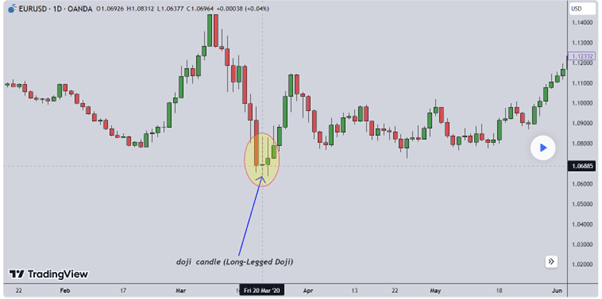
In the above EUR/USD chart, we can observe the formation of the long-legged doji candle. It is easily identifiable by the long wicks and the very short body. The candle shows that both bulls and buyers pushed the price upward and downward, respectively, indicating indecision in the market.
That said, since the candle formed at the end of a downtrend and bulls exerted more pressure than the sellers, it indicates a potential trend reversal. As one can see in the above TradingView chart, the price reversal materialized as three bullish candles formed after it.
How To Trade?
One must keep the following pointers in mind to trade a long-legged doji candle effectively:
- First, identify the candlestick by spotting the distinct features — the small body and long wicks.
- Consider the trend preceding the candlestick. If the pattern appears following an uptrend, a bearish reversal might materialize. On the other hand, the formation of the candlestick after a downtrend signals a potential bullish reversal.
- Determine the entry point. Ideally, once the price goes above this candlestick, one can enter a long position, whereas people can enter a short position if the price drops below the pattern.
- If one enters a long position when the price moves above the pattern, they may consider placing a stop-loss under the pattern. In contrast, if individuals enter a short position after the asset price drops below the candlestick, they can place a stop-loss order above the candle.
- Look for this candle near major support or resistance levels. For instance, if an asset’s price declines and this candlestick forms close to a key support level, it is likely that the price will rise.
- Besides a stop-loss order, traders need to place a take-profit order when trading this candlestick to ensure they can secure the gains. They can use technical indicators, like the simple moving average, to determine the level at which they can place the order.
Examples
Let us look at a few long-legged doji examples to understand the concept better.
Example #1
Suppose Sam, a stock trader, has been observing ABC Company’s daily stock chart. He noticed that the security was in an uptrend, and the price was moving toward a crucial resistance level. At that level, a long-legged doji candlestick pattern appeared in the price chart, signaling indecision in the market and a potential price reversal. He predicted that the stock price would decline and a downtrend would materialize. However, Sam did not want to rely solely on the candlestick.
So, he used the Relative Strength Index (RSI) as well. The RSI value at that price level was above 80, signaling overbought conditions. After considering both the candlestick and the oscillator, he decided to enter a short position to make financial gains. His decision turned out to be correct as the price declined as predicted, and a downtrend materialized.
Example #2
According to HDFC Securities Head of Retail Research Deepak Jasani, a long-legged doji candlestick formed in the Nifty daily chart on June 14, 2024, indicating a potential trend reversal. That said, on the weekly charts, the index gained 0.75%, negating the hanging man’s bearish formation in the preceding week by closing higher than the pattern’s top.
Per Jasani, a movement higher than 23,490 could make the bearish signal on the daily chart void. He believed that Nifty would stay within the range of 23,290 and 23,695 with a slight bullish bias, at least over the near term.
Advantages And Disadvantages
Let us look at the benefits and limitations of such a candlestick in technical analysis.
Advantages
- This candlestick is compatible with different timeframes. Hence, it offers flexibility concerning the execution of a trading strategy.
- The candle helps identify entry as well as exit points. This, in turn, improves the precision of the trade.
- It provides validation for indications from other tools used in technical analysis. This improves decision-making.
- It indicates possible price reversals.
- Lastly, it gives insight into the market sentiment, which helps make better buy and sell decisions.
Disadvantages
- Long-legged doji candlestick patterns are rare. Hence, individuals, especially novice traders, may find them difficult to identify and trade.
- It signals continued price volatility, which makes it challenging for one to make buy and sell decisions.
- It may provide false signals. Hence, one must use other indicators along with it to improve the chances of success.
For professional-grade stock and crypto charts, we recommend TradingView – one of the most trusted platforms among traders.
Disclosure: This article contains affiliate links. If you sign up through these links, we may earn a small commission at no extra cost to you.

