Table Of Contents
What Is Lognormal Distribution In Excel?
Lognormal distribution in statistics calculate and determine the distribution of a variable whose logarithm is normally distributed. The original formula is a very complex formula to calculate. But in Excel, we have a built-in function to calculate the lognormal distribution, the Lognorm.Dist function.

Lognormal distribution returns a continuous statistical distribution of a random variable, a normally distributed logarithm.
For example, consider the below data.

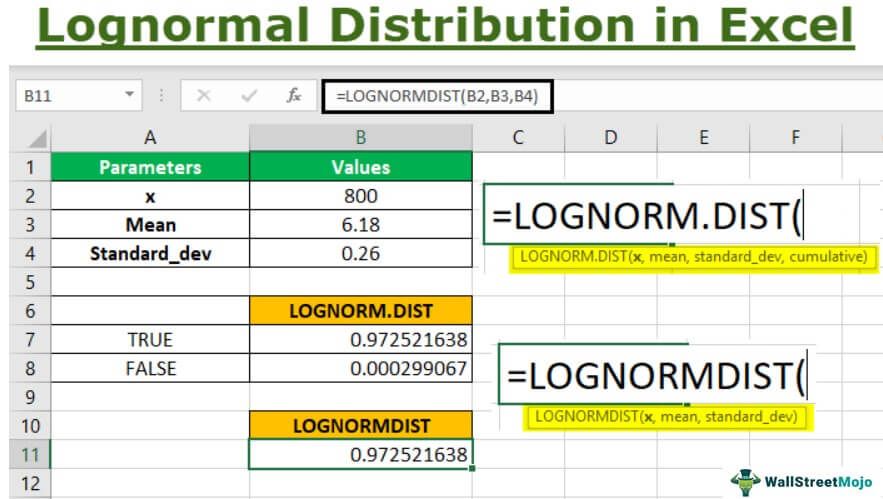
Using Lognormal distribution in Excel, we can find whether the data is TRUE or FALSE as shown in the below image.

Key Takeaways
- The lognormal distribution is a statistical term used to calculate the distribution of a variable whose logarithm is normally distributed. Excel's Lognorm.Dist function simplifies the complex formula for calculating it.
- For the lognormal distribution Excel function, non-numeric arguments will return #VALUE! error, and x=0 or standard deviation <=0 will return #NUM! error. To calculate LOGNORM.DIST, use
- LOGNORM.DIST(x,mean,standard_dev) = NORM.S.DIST((ln(x)-mean)/standard_dev).
- The function, compatible with 2010 and earlier versions, returns the cumulative lognormal distribution of x, where ln(x) is usually distributed with mean and standard_dev.
LOGNORM.DIST() Excel Formula
The syntax of LOGNORM.DIST(x, mean,standard_dev, cumulative) in Excel, returns the lognormal distribution of x, with given parameters for the mean and standard deviation of the natural logarithm, Ln(x). The above function requires the following parameters or arguments:-

x:- the required value of ‘x’ whose lognormal distribution is to be returned.
mean:- mean of Ln(x)
standard_dev:- standard deviation of Ln(x)
cumulative:- If the cumulative is TRUE, then the function returns cumulative distribution. Else FALSE gives the probability density.
How To Calculate Lognormal Distribution In Excel?
The cumulative distribution function (CDF) is a probability variable that takes a value less than equal to x. At the same time, the probability density function (PDF) of a continuous random variable explains the relative likelihood of the random variable x to take on a given value.
Also, LOGNORM.DIST is generally useful in analyzing stock prices as normal distribution cannot be applied to calculate the price of the stocks. We can also use the function to calculate option pricing for the Black Scholes model.
Examples
Now, let us go through some examples for the lognormal distribution used in Excel.
Example #1
Consider below the stock price of the listed companies for arriving at the mean and standard deviation excel parameters.

Follow the below steps:
- To start with, we must calculate the natural logarithm values for the respective stock prices.

As seen in the above data, the = LN(Number) returns the natural logarithm value of the given number. - Next, compute the squared values of the natural logarithm numbers as shown below.

- Now, we would also require the sum of the natural logarithm of the stock price and the sum of squared natural logarithm values to calculate the standard deviation.

- Then, calculate the mean for the natural logarithm for the stock price.
Mean, µ= (5.97 + 5.99 + 6.21 + 6.54)/4
Or µ= 6.18
- Remember, the calculation for standard deviation can be done manually and using a direct Excel formula.
Below is the table for the stock price, the stock price's mean, and standard deviation values.
The standard deviation is calculated using =STDEV.S(Range of natural logarithm column ln(Stock Price)).
However, we can use the above parameters for mean and standard deviation to calculate the Excel lognormal distribution of any given value ‘X’ or stock price as shown below.
Step 1:- Consider the below table to understand LOGNORM.DIST function

Note that the above table shows the parameter values required to calculate the Excel lognormal distribution for x, 10.
Step 2:- Next, we will insert the values in the formula function and select the arguments B2, B3, and B4. Now, we can choose the cumulative parameter option TRUE.
LOGNORM.DIST(x,mean,standard_dev,cumulative)

Next, as shown in the above screenshot, we will first enter the TRUE option to get the cumulative distribution function.

Now, we arrive at the value shown in cell C19 for the cumulative distribution function (CDF).
Step 3:- Now, let us calculate the lognormal distribution in Excel for the probability density function (PDF) by selecting the same argument B2,B3, and B4, and FALSE in the cumulative parameter.

Next, as seen in the above image, we arrive at the result in cell C20 for probability density function (PDF).
Step 4:- As seen in the above function, the LOGNORM.DIST is compatible with the 2010 excel version and later. However, we can also use LOGNORMDIST, which uses the same parameters as the latest versions. Therefore, considering the same parameter values, we will populate the function for LOGNORMDIST, as shown below.

Note that the value is the same as the LOGNORM.DIST for the TRUE parameter in the cumulative argument.
Likewise, we can use Lognormal distribution in Excel.
Example #2
Step 1:- Consider the below table to understand LOGNORM.DIST function

Note that the above table shows the parameter values required to calculate the Excel lognormal distribution for x, 10.
Step 2:- Next, we will insert the values in the formula function and select the arguments B2, B3, and B4. Now, we can choose the cumulative parameter option TRUE.
LOGNORM.DIST(x,mean,standard_dev,cumulative)

Next, as shown in the above screenshot, we will first enter the TRUE option to get the cumulative distribution function.
Now, we arrive at the value shown in cell C19 for the cumulative distribution function (CDF).

Step 3:- As seen in the above function, the LOGNORM.DIST is compatible with the 2010 excel version and later. However, we can also use LOGNORMDIST, which uses the same parameters as the latest versions. Therefore, considering the same parameter values, we will populate the function for LOGNORMDIST, as shown below.

Now, we can see the value resulted in the same figure as the LOGNORM.DIST for the TRUE parameter in the cumulative argument.

Likewise, we can use Lognormal distribution in Excel.
Example #3
Step 1:- Consider the below table to understand LOGNORM.DIST function

Note that the above table shows the parameter values required to calculate the Excel lognormal distribution for x, 10.
Step 2:- Next, we will insert the values in the formula function and select the arguments B2, B3, and B4. Now, we can choose the cumulative parameter option TRUE.
LOGNORM.DIST(x,mean,standard_dev,cumulative)

Next, as shown in the above screenshot, we will first enter the TRUE option to get the cumulative distribution function.
Now, we arrive at the value shown in cell C19 for the cumulative distribution function (CDF).

Step 3:- As seen in the above function, the LOGNORM.DIST is compatible with the 2010 excel version and later. However, we can also use LOGNORMDIST, which uses the same parameters as the latest versions. Therefore, considering the same parameter values, we will use the LOGNORMDIST function, as shown below.

Now, we can see the value is the same as the LOGNORM.DIST for the TRUE parameter in the cumulative argument.

Likewise, we can use Lognormal distribution in Excel.
Important Things To Note
- If any parameter or argument is non-numeric, then the lognormal distribution Excel function will return #VALUE! Error message.
- If arguments x is equal to 0 or if the standard deviation is less than and equal to 0, then the function would return #NUM! Error message.
- Equivalent expression to calculate LOGNORM.DIST is LOGNORM.DIST(x,mean,standard_dev) = NORM.S.DIST((ln(x)-mean)/standard_dev)
- This function is compatible with version 2010.

