Table Of Contents
What Is Likelihood Ratio Test?
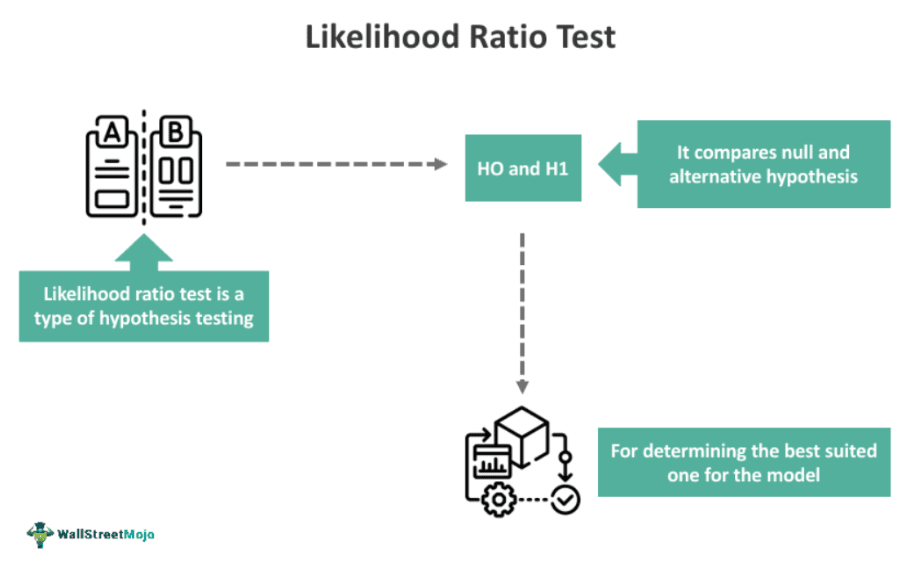
The Likelihood Ratio Test (LRT) refers to statistical hypothesis testing that follows a set way of determining the likelihood (or probability) in a regression model. It compares the two or more nested statistical models to find the most appropriate of them all. The primary goal of this test is to estimate which of the hypotheses fits best with the data provided.
The first log-likelihood ratio test stata was developed by statisticians Jerzy Neyman and Karl Pearson in 1928. Later, other statisticians contributed to the theory. This test helps determine the best hypothesis from among simple and complex hypotheses. As a result, regression models have a better outcome.
Key Takeaways
- The likelihood ratio test is a class of hypothesis testing that compares null and alternative hypotheses to determine which is best suited for a model. It compares the goodness of fit of two nested statistical models.
- Statisticians Jerzy Neyman and Karl Pearson first introduced this concept in 1928. Its main aim is to verify simple and complex models.
- The formula considers the log-likelihood of both nested models and derives the ratio. Once the ratio is determined, it is further compared with the critical value.
- The null hypothesis states that the simpler model is sufficient, and the alternative hypothesis says that the more complex model is a better fit.
Likelihood Ratio Test Explained
The likelihood ratio test in statistics is majorly used in hypothesis testing in regression models. It is a way of verifying (or testing) the null hypothesis against the alternative hypothesis. In the context of multivariate analysis, it is called the Wilks Test. Also, it ascertains which of the two hypotheses is best suited to the model. It evaluates the goodness-of-fit of different models.
The log-likelihood of both hypotheses is considered, and the ratio obtained decides the outcome. So, if a ratio does not justify the model, it gets rejected based on the test. However, the models must be nested to qualify for the test, indicating it relies on the comparison of the log-likelihoods of two nested models.
A nested model contains hypotheses with the same parameters (or variables), but one hypothesis will contain one additional parameter. The additional parameter differentiates the two hypotheses, representing them as null and alternative hypotheses and making the alternative hypothesis more complex than the null hypothesis. However, one of them may be simple, while the other might be complex. Yet, the latter might be justifiable in some cases, even though it has additional parameters.
Another reason to have a complex hypothesis is that additional parameters may increase the likelihood score, indicating a better fit to the observed data. However, it may not be feasible to depend on only one hypothesis. Hence, researchers use the log-likelihood ratio test to verify both hypotheses and determine the effectiveness of the model. However, this test differs from the sequential likelihood ratio test, a statistical hypothesis testing procedure, that makes decisions sequentially based on data as it becomes available.
Compared to this test, the sequential likelihood ratio test focuses on hypothesis testing after every observation. It allows researchers to verify the hypothesis in sequence continuously. It evaluates the hypotheses at each stage of data collection, making room for a more dynamic approach to decision-making.
In addition, even generalized likelihood ratio tests are useful for complex hypotheses. While the Wilks Test works in optimal situations, it is the opposite for the latter. The generalized likelihood ratio test is essential for non-optimal situations where normal testing is possible. As a result, researchers can evaluate the hypothesis and determine its likelihood.
Formula
Every hypothesis test needs a formula to determine its likelihood. Let us look at the formula for the likelihood ratio test.
Likelihood ratio = - 2 log L (m1)log L (m2)
= 2 *
In this above formula, loglik refers to the log-likelihood of the two hypotheses. H0 represents the null hypothesis, while H1 is the alternative hypothesis. The parameters of these hypotheses are represented by m1 and m2. So, if the likelihood ratio is small, the alternative hypothesis is better than the null hypothesis. In short, it rejects the null hypothesis, which is eventually simple. However, if the likelihood ratio is high, it depicts the effectiveness of the null hypothesis.
Assumptions
This test includes certain assumptions about the model that make it valid. Some of them are:
- The regression model must include a nested, meaning that one of the hypotheses must have additional parameters.
- This ratio test relies on a few regularity conditions. It includes maximum likelihood estimates, consistency of estimates, and asymptotic normality of parameters in a null hypothesis.
- The sample size in this ratio must be large. Also, the observations of the parameters must be independent, or the effectiveness of the test may be adversely affected.
Examples
Let us study some examples of likelihood ratio tests to understand the concept better.
Example #1
Suppose Joanna is a researcher who wants to study the relationship between income and education. In this case, she took the positive relationship between the variables as the null hypothesis, meaning higher education levels lead to higher income. The alternative hypothesis considers an employee’s experience, too. It means there may be a negative effect on income due to an employee's experience. Determining the likelihood looked difficult to Joanna at this stage. Hence, she decided to use the likelihood ratio test to get accurate results.
The following is the linear regression model of the above experiment.
- Null hypothesis model (M1):
Y = β0 + β1X +ϵ
- Alternative hypothesis model (M2):
Y = β0+β1X+ β2X2 + ϵ
Here, X refers to the variable representing education, X2 is the variable representing experience, β0, β1, and β2 are the parameters of the above regression lines, and ϵ is the error term of the line.
So, with the help of the log, the likelihood (loglik) of M1 is 1734.21, and for M2, it is 1732.22. Thus, after applying the formula, the ratio is:
LRT = 2*
= 2
= 3.98
Here, the degree of freedom is assumed to be 1, and the significance level is 5% (or 0.05). Therefore, the critical value will be 3.841. Since the likelihood ratio (3.98) is higher than the critical value, Joanna decided to accept the null hypothesis, which states that higher education levels lead to higher income.
Example #2
For the 2022 study conducted to understand the Perceptions of Nigerian Medical Students Regarding Their Preparedness for Precision Medicine, the likelihood ratio test was employed to derive results.
This test was used to evaluate the relationship between knowledge score and medical school year, and 300 respondents participated in this study. However, during the study, it was found that the relationship between knowledge scores, abilities, and medical school was limited in the sense that students had a positive attitude in general toward precision medicine. They also had considerable knowledge about it. However, there were certain shortcomings in the association between knowledge and ability.
In this way, the LRT helped researchers arrive at significant results regarding the attitudes, knowledge, abilities, and scores of medical students studying precision medicine.
Advantages And Disadvantages
Advantages
- It helps choose the right hypothesis for the model. By comparing the likelihoods of the nested models, it helps pick the model that best fits the observed data.
- This test is suitable to measure the nested models. It is well-suited for comparing models with varying levels of complexity and determining which additional parameters considerably improve the model fit.
- It is asymptotically powerful and impactful, thereby increasing the effectiveness of the result.
- It enables the overall evaluation of sequential hypothesis testing.
Disadvantages
- The test only supports large sample sizes. This is because, in smaller sample sizes, the assumptions may not hold true.
- There are certain regularity conditions to run the test. They ensure its validity. Hence, any violation of these conditions may lead to inaccurate results.
- The misspecification of certain variables and parameters may influence the outcome. If the underlying data relationships are not represented correctly, deriving the true or best fit may not be possible.
- There may be limited information about the nature of the models.
Likelihood Ratio Test vs Wald Test vs F Test
Although likelihood ratio, Wald test, and F test are primarily used for hypothesis testing, they differ in certain ways. Let us look at their distinct features in the table below.
| Basis | Likelihood Ratio Test | Wald Test | F Test |
|---|---|---|---|
| Meaning | It refers to the test comparing the null and alternative hypotheses based on their features. | Wald test is a test that verifies a group of selected parameters. It evaluates constraints on statistical parameters. | The F-test tries to evaluate all the models before selecting the best one. It is taken as the ratio of the sample variances of the two populations under consideration. |
| Origin | Jerzy Neyman and Egon Pearson pioneered the concept in 1928. | Mathematician Abraham Wald introduced this concept in 1943. | Ronald Fisher originally propagated this concept in the 1920s. |
| Application | It is applicable only to nested models. | It supports non-nested models. | This test applies to a wide range of models. |
