Table Of Contents
What Is Kruskal Wallis Test?
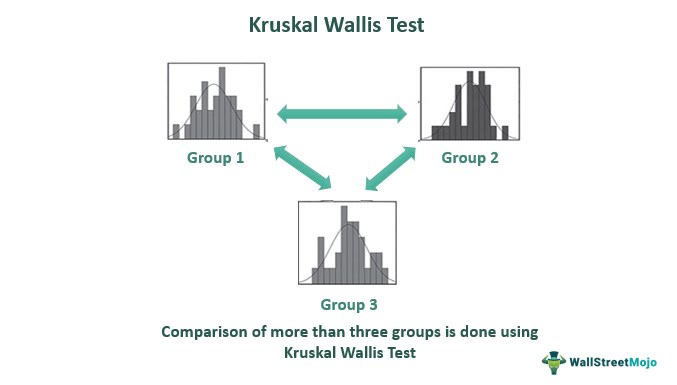
Kruskal Wallis Test refers to a method of matching the medians of more than two groups for ascertaining whether the samples have the same group source as an origin or not. It is a key tool for comparing three or more groups based on a dependent variable by measuring at a categorical level.
It applies to the distribution of less or non-parametric population for contrasting more than two distinct and equal-sized data samples. This test examines the null hypothesis, which claims that 'k' samples from the same population had identical median values. It indicates the dominance of one sample of the variable over the other sample stochastically.
Key Takeaways
- Kruskal Wallis Test is a method to determine the dominance of a variable of one sample over a variable of another sample when the number of groups is more than three by comparison of their median in a parametric manner.
- It has certain determinants like - more than three conditions and the absence of normally distributed data to apply the test.
- It is used only when more than three groups have independent variables and more than three categories of data.
- The value of p is always more than 0.05, indicating little power of the test.
Kruskal Wallis Test Explained
Kruskal Wallis H test is a type of one-way ANOVA test based on ranks that use statistical methods to compare the medians of more than two groups. So, one can apply it to all distributions containing variables that are either ordinal or dependent continuous levels. However, although it can establish which variables dominate within a group, it fails to answer the reason for dominance.
The test in consideration is applicable only when the following conditions take place:
- One has more than three conditions for comparison.
- Every condition is regulated by a distinct participant group, meaning if one has the design of independence measures having more than three conditions.
- The data for applying the test is not distributed normally.
- The data being measured have markedly different variances related to different conditions.
After the above conditions are met, the test is performed to check whether the outcome of one group under the test affects the outcome of the other sample in consideration.
The test assesses various data sets for understanding the interchange of data samples amongst numerous data sets. Then the null hypothesis is utilized to know whether the medians are equal as opposed to the alternative hypothesis, which suggests the difference in at least one of the samples exists. Machine learning also takes the help of the test to ascertain the difference between two or more groups without telling the reason for the existing difference between them.
Factors
Let us understand the concept by learning how test anxiety influences test results. Three possible values for the independent variable "test anxiety" exists –
- No anxiety,
- Low-medium anxiety, and
- High anxiety.
The dependent variable is the exam score, scaled from 0 to 100%.
Another example is learning how socioeconomic status influences perceptions of increasing sales tax. Socioeconomic status has three tiers:
- Working class,
- Middle class, and
- Wealthy,
These are the independent variable. The dependent variable is measured on a 5-point Likert scale, from strongly agree to disagree strongly.
Assumptions
The researcher's variables ought to include the following Kruskal Wallis test assumptions:
- Two or more tiers and one independent variable (independent groups). The test is more frequently administered when statisticians have three or more levels. Consider utilizing the Mann-Whitney U Test for two levels instead.
- Dependent variables with an interval, ratio, or ordinal scale.
- Statisticians' observations ought to be impartial. Put another way, it shouldn't have any connections between the individuals who make up each group or between groupings.
- The distributions of shapes for all groups ought to be uniform. Most testing tools, including SPSS and Minitab, will check for this condition.
Formula
Let us determine the Kruskal Wallis test formula for comparing medians of more than two groups. Below given is the formula for the test:
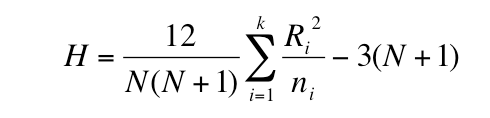
Where,
- K = number of groups used for comparison
- N = total size of the sample
- ni = i-th group's sample size
- Ri = total of the ranks related to i-th group
The above formula is valid only for a group of samples:
- Having a minimum of five elements.
- Group having no estimated population barriers.
- The distribution of the population has no assumption.
- Samples groups are independent.
- Random selection of data in every group.
- Having a very minimal ordinal.
Moreover, certain websites and software provide Kruskal Wallis test calculators for solving the formula.
Calculation Example
Let us use a Kruskal Wallis test example to understand the concept easily. Let there be three machines, sewing machine 1, sewing machine 2, and sewing machine 3, with the following details and ranking:
| Sewing Machine 1 | Time | Rank |
|---|---|---|
| M1 | 23.74 | 13 |
| M1 | 24.10 | 14 |
| M1 | 25.10 | 15 |
| M1 | 25.40 | 16 |
| M1 | 26.31 | 17 |
| Sewing Machine 2 | Time | Rank |
|---|---|---|
| M2 | 21.60 | 7 |
| M2 | 21.80 | 8 |
| M2 | 22.20 | 9 |
| M2 | 22.75 | 10 |
| M2 | 23.40 | 11 |
| Sewing Machine 3 | Time | Rank |
|---|---|---|
| M3 | 19.75 | 6 |
| M3 | 20.00 | 4 |
| M3 | 20.40 | 3 |
| M3 | 20.60 | 2 |
| M3 | 21.60 | 7 |
Let us apply the Kruskal Wallis Test to the sample data:
| Kruskal-Wallis Test | |
|---|---|
| Sum of Ranks Group 1 | 75 |
| Sample Size Group 1 | 5 |
| Sum of Ranks Group 2 | 45 |
| Sample Size Group 2 | 5 |
| Sum of Ranks Group 3 | 22 |
| Sample Size Group 3 | 5 |
| Total Sample Size n | 15 |
| Total Sum of Ranks | 120 |
| Total Sums Check | Failed--review manually assigned ranks. |
| a | 0.05 |
| Sum of Squared Ranks/Sample Size | 1626.8 |
| H | 33.34 |
| Number of groups | 3 |
| Critical Value | 5.991476357 |
| p-value | 5.75852E-08 |
| Decision | Reject |
Hence, one can see that the Kruskal-Wallis test has little power as the value of p is always greater than 0.05.
When To Use Kruskal Wallis Test?
A continuous or ordinal dependent variable may be subjected to this rank-based nonparametric test to evaluate whether statistically significant differences exist between two or more independent variable groups of the independent variable. Certain scenarios where the Kruskal Wallis test can be used exist, such as:
- One desires to know whether various groups vary in their key variable.
- The variable one is interested in is ongoing.
- There are three or more categories.
- Variables have at least one independent variable containing more than two independent groups.
