Table Of Contents
What Is Interquartile Range (IQR)?
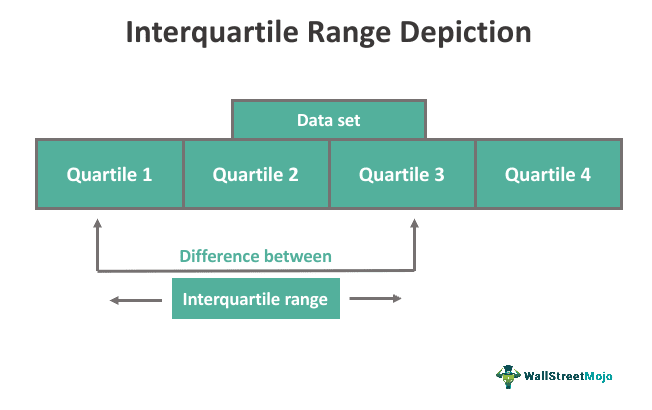
The Interquartile Range (IQR) is the difference in range between the first quartile (Q1) and the third quartile (Q3) in a dataset. In other words, it is a statistical measure of variance that indicates the median dispersion of the points in a data collection.
The IQR, representing the middle 50% of data values, provides a more accurate view of data distribution in a sample set. It measures the spread of data points from the mean, aiding in identifying outliers. One can combine with other statistical measurements, such as median, mean, or standard deviation, to test for normal distribution.
Key Takeaways
- The Interquartile Range (IQR) is a measure of statistical dispersion between the first quartile (Q1) and the third quartile (Q3) in a dataset. It is less influenced by outliers, making it a robust measure of variability.
- The formula to calculate IQR is IQR = Q3 - Q1.
- IQR helps identify the typical range of data, detect outliers, and understand the spread of values.
- However, IQR does not provide a complete picture of the entire dataset and may overlook valuable information in extreme values.
Interquartile Range Explained
The interquartile range is the difference between the 25th and the 75th percentiles of a given data set. Hence, one can refer to it as the 50% (middle) of the data. The partitioned values are called quartiles. They divide a given series into four distinct segments. There are three such quartiles, and the segments are all in the same sizes. The first quartile, the lower quartile, is marked by Q1. The second quartile is Q2, and the third quartile, sometimes called the upper quartile, is Q3. The IQR is the difference between the Q1 and Q3.
In detail, the data value with 50% of the numbers above and below is the middle of the IQR. The data value of the series with 25% of other values above it and 75% below it is referred to as the upper quartile. This is Q3. The data value of the series with 75% of values above it and 25% below is the lower quartile. This is the Q1. A larger IQR value means the data points are more evenly distributed, whereas a lower IQR value suggests that the data points are more tightly placed around the mean. The IQR calculates the amount of data spread between the medians of the first (Q1) and third (Q3) quartiles instead of the range, which calculates the total amount of data spread.
Formula
The formula for calculating IQR does not require an interquartile range calculator.
The formula to calculate the Interquartile Range is IQR = Q3 - Q1.
However, there are online interquartile range calculators available.
Examples
Check out these calculation examples for a better idea:
Example #1
Let us consider a dataset of salaries of XYZ Company given to their employees for ten months: $20,000, $40,000, $25,000, $50,000, $30,000, $60,000, $35,000, $45,000, $55,000, and $65,000. To calculate the IQR, we first need to find the values of Q1 and Q3.
We follow these steps to calculate the interquartile range for the given dataset of salaries in XYZ company:
Step 1: Sort the dataset of salary values in ascending order:
20,000, 25,000, 30,000, 35,000, 40,000, 45,000, 50,000, 55,000, 60,000, and 65,000.
Step 2: Find the first quartile (Q1):
The under half of the given dataset is characterized by median Q1. In this case, the lower half is $20,000, $25,000, $30,000, $35,000, and $40,000. One can obtain the lower half by taking the data set's first half. Since we have an odd number of values, the median is the middle value of $30,000. Therefore, Q1 value = $30,000.
Step 3: Find the third quartile (Q3):
Q3 is the median of the dataset's upper half. The upper half is obtained by taking the data set's first half. In this case, the upper half is $45,000, $50,000, $55,000, $60,000, and $65,000. The median is the middle value, which here is $55,000. Thus, Q3 value = $55,000.
Step 4: Calculation of the IQR:
The IQR is the difference between Q3 and Q1 values.
IQR = Q3 - Q1
= $55,000 - $30,000
= $25,000.
Therefore, the Interquartile Range (IQR) for XYZ Company’s given dataset of salaries is $25,000.
Example #2
Let us consider the example of ABC Ltd, where they calculate the Interquartile Range for financial reasons, specifically to determine their investments' performance.
They have a solid reasoning behind it.
Analysts often use the IQR to examine investments like stocks and mutual funds. They consider this assessment while examining trends, risks, and profit-generating opportunities. Additionally, corporate accountants may use IQR to make decisions on various financial matters. Additionally, financial organizations that give loans and credit may take this value into account when examining average credit scores and the distribution of data surrounding those average scores.
Advantages And Disadvantages
Some of the advantages and disadvantages of IQR are given as follows:
Advantages
- The interquartile range is a reliable measure of variability even when the extreme values are not precisely documented (for example, in cases of open-ended class intervals in a frequency distribution).
- As a measure of dispersion, the IQR resists extreme values as it cannot be mathematically manipulated.
Disadvantages
- The interquartile range is a positional measure based on only the twenty-fifth and seventy-fifth percentiles, which is a disadvantage. The standard deviation and variance measures address this defect by considering the value associated with each case.
- It does not depend on the number of observations and is less sensitive to outliers at the other end of the range.
Interquartile Range vs Range vs Median
The differences between the three are as follows:
| Key points | Interquartile Range | Range | Median |
|---|---|---|---|
| Concept | The Interquartile Range (IQR) is a measure of data spread between the first quartile (Q1) and the third quartile (Q3), focusing on the middle 50% of the data. | The range is the difference in values between the dataset's maximum and minimum values. | The median, the middle value in a dataset, represents the central tendency and divides the data into two halves when arranged in ascending or descending order. |
| Significance | It measures the spread of values in a data set. The IQR specifically concentrates on the range between the first and third quartiles. | The range indicates total variability or simply the spread of observations. | The median reflects the midpoint value of a dataset. |
| Calculation | It is calculated by subtracting Q3 - Q1, where Q3 represents the third quartile and Q1 represents the first quartile. | It is calculated by taking the difference between the Maximum and Minimum values. | If the dataset has an odd number of values, the median value is the middle value. |
