Table Of Contents
Interpolation Meaning
Interpolation is the mathematical procedure applied to derive value between two points having a prescribed value. In simple words, we can describe it as a process of approximating the value of a given function at a given set of discrete points. Hence, one can apply it in estimating varied cost concepts, mathematics, statistics, etc.

An interpolation equation is the method of determining the unknown value for any given set of functions with known values. The unknown value is found. If the given sets of values work on a linear trend, then we can apply linear Interpolation in excel to determine the unknown value from the two known points.
Key Takeaways
- Interpolation is the mathematical procedure to get a value between two points having a prescribed value. In other words, it is a process of approximating the value of a given function at a given set of discrete points.
- Data scientists may also use interpolation to identify and derive meaningful results from raw values.
- Organizations can analyze financial information depending on the cost of goods sold, profits earned, etc.
Interpolation Explained
Interpolation refers to the mathematical method used by investors to predict the unknown price or potential future price of a security or an asset using the related known values. Investors, traders, or analysts can use a consistent trend line across specific data points to estimate the future value or movement of the price of the security.
They are common facets in the world of investing, as most charts representing the volume or price action are interpolated data points that help investors gauge the movements in the price of the security. However, it is essential to also understand the other end of the concept’s acceptance that it has frequently been criticized for not being accurate and does not interpret the volatility of a publicly traded stock.
There are multiple ways to calculate this metric such as linear, polynomial, and piecewise constant interpolation, which shall be discussed over the course of this article. An interpolation equation is often confused with extrapolation which refers to the metric that calculates a data point beyond the observable range of the data.
Formula
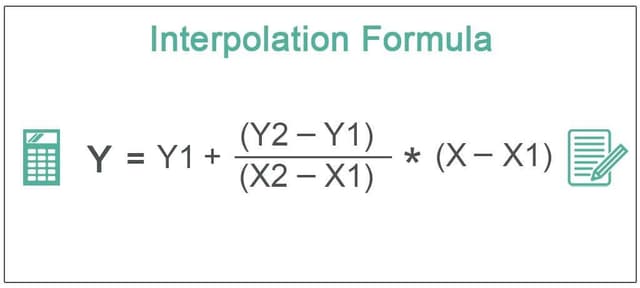
Let us understand the formula to calculate the linear interpolation and other such forms. The formula shall act as a basis for our understanding of all the related factors of this concept.
Y = Y1 + (Y2 - Y1)/(X2 - X1) * (X * X1)
As we have learned in the definition stated above, it helps to ascertain a value based on other sets of values in the above formula: –
- X and Y are unknown figures they will ascertain based on other values.
- Y1, Y2, X1, and X2 are given variables that will help determine unknown values.
For example, A farmer engaged in farming mango trees observes and collects the following data regarding the tree's height on particular days: –
| No. of Days | Height of Tree (MM) |
|---|---|
| 1 | 10 |
| 2 | 20 |
| 3 | 30 |
| 4 | 40 |
Based on the given data set, farmers can estimate the height of trees for any number of days until the tree reaches its normal height. For example, based on the above data, the farmer wants to know the tree's height on the 7th day.
The farmer can find it out by interpolating the above values. The height of the tree on the 7th day will be 70 MM.
Methods
The different types of this concept include linear interpolation among others which are discussed below.
- Linear Method: This method calculates the data by applying an exclusive linear polynomial between every pair of data points for each curve or for a set of three curves for surfaces.
- Cubic Spline Method: This method fits a distinct cubic polynomial between every pair of data points for each curve or for a set of three curves for surfaces.
- Thin-Plate Spline Method: This method can only be applied to surfaces. This method has only smooth surfaces that also extrapolate efficiently.
- Biharmonic Method: This method is applicable only to surfaces.
- Nearest Neighbour Method: Under this method, an interpolated point is inserted into the value of the nearest adjacent point of data. Hence, no new data points are produced.
Examples
Now that we have an understanding of the basics and the formula of an interpolation equation, let us look at a few examples to provide us with a practical overview and applicability of the concept.
Example #1
Calculate the unknown value using the interpolation formula from the data set. For example, calculate the value of Y when the X value is 60.
| X | Y |
|---|---|
| 10 | 0 |
| 30 | 40 |
| 50 | 80 |
| 70 | 120 |
| 90 | 160 |
Solution:
The value of Y can be derived when X is 60 with the help of Interpolation as follows: –
Here X is 60, and Y needs to be determined. Also,
| X1 | 50 |
| Y1 | 80 |
| X2 | 70 |
| Y2 | 120 |
So, the calculation of interpolation will be –

- Y= Y1 + (Y2-Y1)/(X2-X1) * (X-X1)
- =80 + (120-80)/(70-50) * (60-50)
- =80 + 40/20 *10
- = 80+ 2*10
- =80+20

- Y = 100
Example #2
Mr. Harry shares details of sales and profits. He is eager to know the profits of his business when the sales figure reaches $75,00,000. You are required to calculate profits based on the given data:
| Sales | Profits |
|---|---|
| 1,000,000 | 200,000 |
| 2,000,000 | 300,000 |
| 3,000,000 | 400,000 |
| 4,000,000 | 500,000 |
| 5,000,000 | 600,000 |
Solution:
Based on the above data, we can estimate the profits of Mr. Harry using the interpolation formula as follows:
Here,
| X | 7,500,000 |
| Y1 | 500,000 |
| Y2 | 600,000 |
| X1 | 4,000,000 |
| X2 | 5,000,000 |
So, the calculation of interpolation will be:

- Y= Y1 + (Y2-Y1)/(X2-X1) * (X-X1)
- = $ 5,00,000 + ($6,00,000 - $5,00,000)/($50,00,000 - $40,00,000) * ($75,00,000 - $40,00,000)
- = $ 5,00,000 + $1,00,000 / $10,00,000 * $ 35,00,000
- = $5,00,000 + $ 3,50,000

- Y = $8,50,000
Example #3
Mr. Lark shares details of production and costs. In this era of global recession fears, Mr. Lark is also afraid of decreasing the demand for his product. He is eager to know the optimum production level to cover the total cost of his business. You are required to calculate the optimum quantity level of production based on the given data. Lark wants to determine the quantity of production required to cover the estimated cost of $90,00,000.
| Quantity | Cost ($) |
|---|---|
| 10,000 | 4,000,000 |
| 200,000 | 4,500,000 |
| 300,000 | 5,000,000 |
| 400,000 | 5,500,000 |
| 500,000 | 6,000,000 |
Solution:
Based on the above data, we can estimate the quantity required to cover the cost of $90,00,00 using the interpolation formula as follows:
Here,
| Y | 9,000,000 |
| Y1 | 5,500,000 |
| Y2 | 6,000,000 |
| X1 | 400,000 |
| X2 | 500,000 |
Y= Y1 + (Y2-Y1)/(X2-X1) * (X-X1)
To get the quantity of production required, we have modified the above formula as follows:
X = (Y - Y1) / + X1

- X =(9,000,000 - 5,500,000) / + 400,000
- = 3,500,000 /(5,00,000/1,00,000) + 400,000
- = 3,500,000 /5 + 400,000
- = 7,00,000 + 400,000
- = 11,00,000 Units
Relevance And Use
In the era where data analysis plays an important role in every business, an organization can use linear interpolation and other such forms of this calculation to estimate different values from the known values. Mentioned below are some of the relevance and uses of interpolation.
- Data scientists can use interpolation to analyze and derive meaningful results from a given set of raw values.
- Organizations can determine any financial information based on a given set of functions like the cost of goods sold, and profits earned, etc.
- Interpolation is being used in numerous statistical operations to derive meaningful information.
- Scientists are using this to determine possible results out of numerous estimates.
- A photographer can also use this concept to determine useful information from raw collected data.
Interpolation Vs Extrapolation
Even though both these concepts help forecast the movement based on a known set of data, there are a few differences in their fundamentals and implications. Let us understand the differences through the comparison below.
Interpolation
- Interpolation is used to forecast or predict values that exist within a data set.
- It is often considered less risky in comparison with extrapolation. Therefore, investors, traders, and analysts use it in high-stake situations.
- There are different methods such as linear interpolation, polynomial, and spline interpolation methods.
- An easy way to recognize a chart or report with this concept being used is through the word “inter” which means “among” the existing data points.
Extrapolation
- Extrapolation is used to predict or forecast values of a data point outside the known data set. As in, it is used to find unknown values to through the known data points.
- It is considered riskier than interpolation and less accurate as well by some users.
- There are different methods similar to interpolation like linear extrapolation, conic extrapolation, and polynomial extrapolation.
- A simple way to recognize a chart or report with this calculation being used is through the word “extra” which often translates to “outside” the known values of a data set.