Table Of Contents
Indexation Meaning
Indexation is a way of adjusting the purchase price of an investment based on inflation. The investment could be a bond, debenture, or asset class. Governments and businesses frequently use this as a value adjustment mechanism.

Investors commonly use this method to reduce taxes on the sale of investments. Since the adjusted purchase price of an asset (which is often higher than its actual purchase price) is considered, the return values are curtailed—lowering taxable income.
Key Takeaways
- Indexation is the mechanism of adjusting the values of various goods, services, assets, investments, and wages based on inflation.
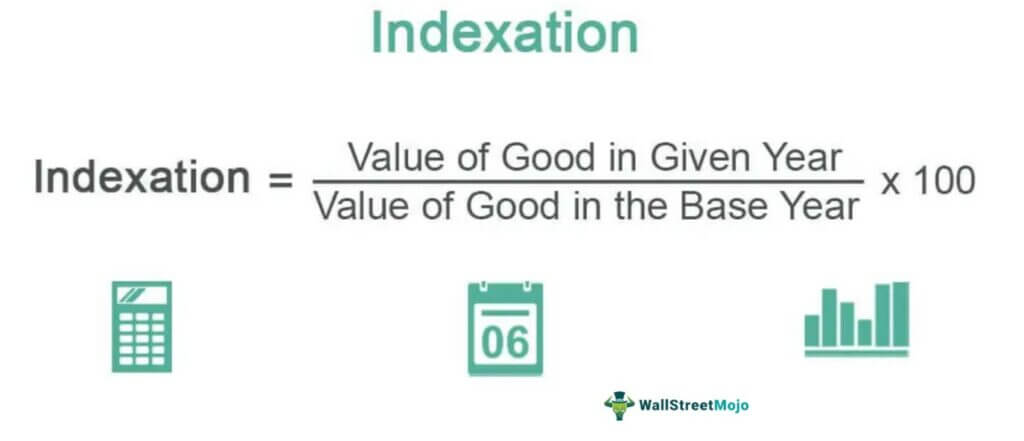
- The indexation formula is as follows: Indexation = (Goods Value in the Given Year/Goods Value in the Base Year) × 100.
- It is a crucial technique used for ascertaining the Consumer Price Index (CPI), Cost Inflation Index (CII), Consumer Confidence Index (CCI), Business Confidence Index (BCI), Composite Index (COMP), and the Raw Material Price Index.
Indexation Explained
Indexation helps recognize the adjusted value of goods, services, assets, and investments in a given year by comparing its value with a base year. The changes are mainly caused by inflation. For example, if the base year index of goods is taken to be 100, then its value in the given year is adjusted to identify a change. It is a crucial metric used by governments and businesses to adjust prices.
Every financial year, the government issues an inflation index to show the impact of inflation on the prices of different products or services. The inflation index determines the real value of long-term investments. Further, it plays a key role in ascertaining consumer price index, composite index, consumer confidence index, business confidence index, and raw material price index. Indexation is computed by registered authorities. In addition to inflation, It is used to adjust the cost of goods and discrepancy in wages.
Indexation Table and Chart
An indexation table lists the index values of various investments, assets, goods, services, and wages. These values range over consecutive years and are presented in a tabular format. Given below is an example of the table:

This Consumer Price Index (CPI) table represents the changes in the US Consumer Price Index (CPI) every month.
An indexation chart is the graphical presentation of the data mentioned in the corresponding indexation table. Analysts and viewers use it to determine the ups and downs of the index values quickly. Now, let us see the graph for the example mentioned above:

Source – ycharts.com/indicators/cpi
Formula
It is the change in the value of a particular asset over time. It can be derived as the value of the goods in a given year divided by its value in the base year, multiplied by 100. The equation is as follows:

Here, the given year is the relevant fiscal year for which the index of goods or services is evaluated. The base year is the purchase year, and the price so stated is the actual purchase price of the product, asset, or investment.
Calculation
Indexing requires an accurate calculation of the values and the choice of a suitable base year.
- The first step is to ascertain the relevant base year. This is usually done by authorized agencies.
- The next step is to ascertain the value of the goods in the base year.
- Then, the value of goods for the given year is ascertained.
- To determine the final value, apply the indexation formula:
Indexation = (Goods value in the given year/Goods value in the base year) X 100.
The result obtained is the price index for the particular product and can vary from year to year. Thus, comparing various time frames is essential to predict future price indexes. On top of expertise in the field, preparing an index requires knowledge of the locale's prevalent economic and social scenarios.
Indexation Example
Let us look at a numerical. The last six years gold prices for the US are listed below:
| Year | Price ($)/Kg |
|---|---|
| January 2017 | 38439.43 |
| January 2018 | 42448.63 |
| January 2019 | 41098.30 |
| January 2020 | 49013.81 |
| January 2021 | 60882.58 |
| January 2022 | 58316.63 |
Source - https://goldprice.org/.
Now, based on the above data, determine the gold price index for all mentioned years. Use 2017 as the base year.
Solution:
| Given Period | Gold Value in the Given Period | Gold Value in the Base Period | Gold Price Index |
|---|---|---|---|
| Jan-18 | 42448.63 | 38439.43 | 110.4299153 |
| Jan-19 | 41098.3 | 38439.43 | 106.9170381 |
| Jan-20 | 49013.81 | 38439.43 | 127.5092008 |
| Jan-21 | 60882.58 | 38439.43 | 158.3857513 |
| Jan-22 | 58316.63 | 38439.43 | 151.7104442 |
Clearly, January 2019 price index is slightly lower than January 2018 price index. But after that, the trend reversed. The price index accelerated all the way to 158.38 in January 2021. After 2021, the value falls a bit, down to 151.71 in January 2022.
Benefits
Indexing is beneficial for the following reasons.
- The Cost Inflation Index (CII) aids in reducing the tax burden of investors by lowering the taxable income because the adjusted value of an investment (usually higher than the actual purchase price) shows lesser profits.
- Enterprises employ this technique to remove worker wage disputes. Indexes standardize pay—workers get fair wages even during economic downturns.
- The companies use raw material price indexes to normalize fluctuations in raw material costs. This eventually helps modify the cost price and selling price.
- It even facilitates the adjustment of the prices among two substitute goods available in the market.
- In addition to price indexation, the confidence level among the businesses and consumers is also calculated.
- It helps the government determine the change in goods and service values due to inflation—Consumer Price Index (CPI).
- It is used in determining the cost of living for different demographics.
