Both these types of distributions help identify the probability or chances of an event occurring a specific number of times in n number of trials. However, they still differ. Let us look at the differences between the two:
Table Of Contents
What Is Hypergeometric Distribution?
Hypergeometric distribution is a distinct probability distribution that defines the k successes probability (some random draws for the object drawn that has some specified feature) in n no of draws, without any replacement, from a given population size N that includes accurately K objects having that feature, where the draw may succeed or may fail.

The probability of a hypergeometric distribution is derived using the number of items in the population, number of items in the sample, number of successes in the population, number of successes in the sample, and few combinations.
Key Takeaways
- In statistics and the probability theory, hypergeometric distribution means a distinct distribution that displays the k successes probability in n no of draws, without any replacement, from a given population size N.
- The length N includes precisely K objects with that feature, where the interest may succeed or fail.
- The hypergeometric distribution probability can be obtained utilizing the number of items in the population, number of items in the sample, number of successes in the population, number of wins in the model, and few combinations.
- The hypergeometric distribution concept is essential because it accurately analyzes the probabilities when the number of trials is not very large and when samples are considered from a finite population without replacement
Hypergeometric Distribution Explained
Hypergeometric distribution plays a vital role in statistics and probability theory as it helps make selections from two groups without replacing the members of those groups. To see how to calculate it, let us follow the below steps:
- Firstly, determine the total number of items in the population, which is denoted by N. For example, the number of playing cards in a deck is 52.
- Next, determine the number of items in the sample, denoted by n—for example, the number of cards drawn from the deck.
- Next, determine the instances which will be considered to be successes in the population, and it is denoted by K. For example, the number of hearts in the overall deck, which is 13.
- Next, determine the instances which will be considered to be successes in the sample drawn, and it is denoted by k. E.g., the number of hearts in the cards drawn from the deck.
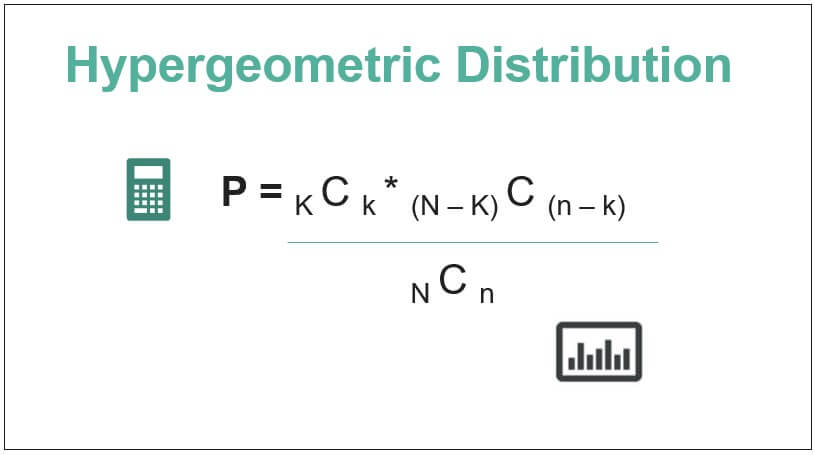
- Finally, the formula for the probability of a hypergeometric distribution is derived using several items in the population (Step 1), the number of items in the sample (Step 2), the number of successes in the population (Step 3), and the number of successes in the sample (Step 4) as shown below.
P = K C k * (N - K) C (n - k) / N C n
Formula
Mathematically, the hypergeometric distribution for probability is represented as:
where,
- N = No. of items in the population
- n = No. of items in the sample
- K = No. of successes in the population
- k = No. of successes in the sample
The mean and standard deviation of a hypergeometric distribution are expressed as,
Examples
Let us consider the following hypergeometric distributions examples to check how it works:
Example #1
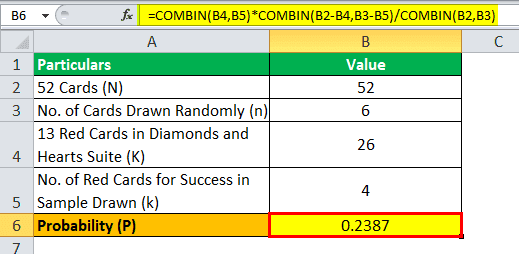
Let us take the example of an ordinary deck of playing cards from where 6 cards are drawn randomly without replacement. First, determine the probability of drawing exactly 4 red suit cards, i.e., diamonds or hearts.
- Given N = 52 (since there are 52 cards in an ordinary playing deck)
- n = 6 (Number of cards drawn randomly from the deck)
- K = 26 (since there are 13 red cards each in diamonds and hearts suit)
- k = 4 (Number of red cards to be considered successful in the sample drawn)
Solution:
Therefore, the calculation of the probability of drawing exactly 4 red suits cards in the draw 6 cards using the above formula is as follows:

Probability = K C k * (N - K) C (n - k) / N C n
= 26 C 4 * (52 - 26) C (6 - 4) / 52 C 6 = 26 C 4 * 26 C 2 / 52 C 6
= 14950 * 325 / 20358520
The probability will be -

Probability = 0.2387 ~ 23.87%
Therefore, there is a 23.87% probability of drawing exactly 4 red cards while drawing 6 random cards from an ordinary deck.
Example #2
Let us take another example of a wallet that contains 5 $100 bills and 7 $1 bills. If 4 bills are chosen randomly, then determine the probability of choosing exactly 3 $100 bills.
- Given, N = 12 (Number of $100 bills + Number of $1 bills)
- n = 4 (Number of bills chosen randomly)
- K = 5 (since there are 5 $100 bills)
- k = 3 (Number of $100 bills to be considered a success in the sample chosen)
Solution:
Therefore, the calculation of the probability of choosing exactly 3 $100 bills in the randomly chosen 4 bills using the above formula is as follows:

Probability = K C k * (N - K) C (n - k) / N C n
= 5 C 3 * (12 - 5) C (4 - 3) / 12 C 4 = 5 C 3 * 7 C 1 / 12 C 4
= 10 * 7 / 495
The probability will be -

Probability = 0.1414 ~ 14.14%
Therefore, there is a 14.14% probability of choosing exactly 3 $100 bills while drawing 4 random bills.
When To Use?
The concept of hypergeometric distribution is important because it provides an accurate way of determining the probabilities when the number of trials is not very large and when samples belong to a finite population without replacement. The hypergeometric distribution is analogous to the binomial distribution, used when the number of trials is substantially large. However, hypergeometric distribution is all about sampling without replacement.
Hypergeometric Distribution Vs Binomial Distribution
| Category | Hypergeometric Distribution | Binomial Distribution |
|---|---|---|
| 1. Replacement | Replacement of group members does not occur
| Replacement of group members occurs
|
| 2. Variation | The probability changes with every trial. | The probability remains constant with every trial. |
| 3. Usage | Used in a population small as the outcome has a large effect on the probability of a situation being an event or non-event. | Used in a population large enough for the outcome to have an effect on the probability of a situation being an event or non-event. |

