Table Of Contents
What Is Harami Cross?
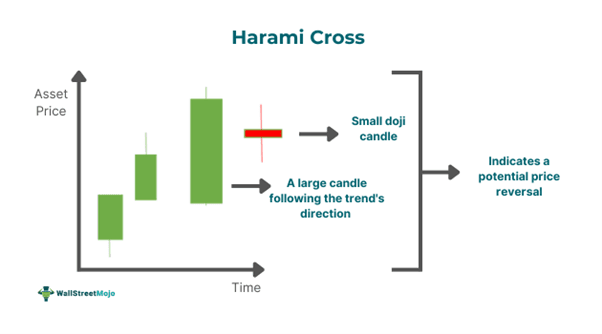
A Harami Cross refers to a two-candlestick pattern where the first candle follows the trend’s direction, and the second one is a small doji engulfed by the former’s large body. This pattern indicates a potential trend reversal and helps traders make financial gains.

Such a candlestick pattern can be bullish or bearish depending on the direction in which a financial instrument’s price is moving. In a price chart, if a bullish harami cross appears, it signals a potential change in the trend’s direction to the upside. In contrast, the bearish counterpart indicates a potential downside reversal.
Key Takeaways
- Harami cross meaning refers to a candlestick pattern that consists of a couple of candles.
- The difference between a bullish and a bearish harami cross is that the former indicates that the asset’s price will likely rise.
- A noteworthy limitation of this pattern is that it often gives false signals. Hence, one cannot rely on it only for making trading decisions.
Harami Cross Pattern Explained
Harami cross meaning comprises a small doji candlestick pattern entirely contained within the body of a preceding large candlestick that follows the trend’s direction. It enables traders to spot potential trend reversals, which, in turn, enables them to execute trades that can result in profits.
The first candlestick is long, representing the sellers or buyers are in complete control. That said, the doji candlestick represents indecision among market participants, irrespective of whether it is bearish or bullish. Moreover, it signals the potential reversal or slowing of the trend in case it forms near the bottom or top of that particular trend.
This candlestick pattern can indicate a bearish or bullish reversal, depending on the direction in which the price of the financial instrument is moving. For instance, if this pattern appears in a downtrend, it is an indication that an uptrend is on the horizon.
How To Trade?
Individuals can consider the following points to trade harami cross pattern effectively:
- Pattern Identification: Spot the pattern by identifying its distinct characteristics.
- Confirmation: Wait for the confirmation following the pattern's formation. Note that this confirmation may materialize as a candle that closes beyond the range of the doji. Moreover, it should be in line with the anticipated reversal. This means a close below the doji for a bearish pattern and a close above the small doiji candle for the bullish variant.
- Check Volume: A significant increase in volume after the pattern’s formation is a stronger indication of the price reversal.
- Stop-Loss: Placing a stop-loss order is crucial to limit losses. One may pace this order just beyond the extremes of this pattern. Precisely, for a bullish harami cross, they can place it below the low of the doji. In contrast, if the pattern is bearish, individuals can place the stop loss at a level just higher than the high of the doji.
- Use Other Indicators: This pattern alone is often not reliable. Hence, experts recommend using it with other technical analysis indicators, like relative strength index (RSI), moving averages, etc.
- Position Sizing: Individuals must tailor their position sizes on the basis of the strength of the signal generated by the two-candlestick pattern. Note that it is vital to proceed with caution when engaging in position sizing, especially if this pattern’s formation takes place in volatile market conditions or in case the confirmation is weak.
In addition, trades must take into account the overall market scenario when buying or selling based on this pattern’s formation.
Examples
Let us look at a few harami cross examples to understand the concept better.
Example #1
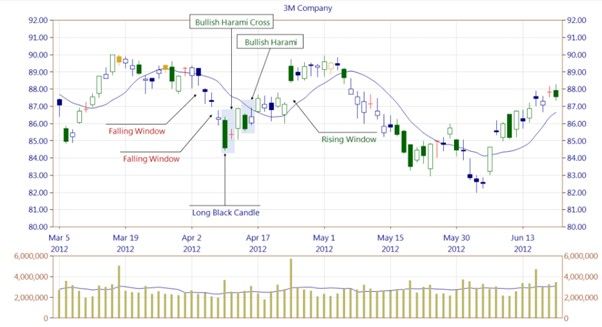
The following candlestick chart is of 3M Company:

In the above chart, we can spot the bullish harami cross candlestick. The pattern has one large candle appearing in a downtrend, followed by a doji that is completely contained within the former.
Suppose John, a trader who was tracking the stock, spotted this candlestick. He predicted that a price reversal would be forthcoming and checked the volume as well. The indicator showed a significant increase. Thinking the price would go up, John placed a buy order when the price level increased beyond the upper wick of the small doji candlestick. As one can observe, his decision turned out to be correct since an uptrend materialized following the pattern’s formation.
Example #2
According to a report published in June 2023, a bullish Harami cross appeared in the price chart of Interglobe Aviation — the holding company of IndiGo. The stock’s close was Rs. 2356, and there was a marginal surge of 0.68%. The company cemented its place as one of the leading players in India’s aviation space, especially because of two reasons — its customer-centric approach and operational efficiency.
Since a bullish harami cross signals a potential price reversal, investors could have considered investing in the company. However, they should have taken the decision by combining other key indicators with the candlestick pattern.
Advantages And Disadvantages
Let us look at the benefits and limitations of this candlestick pattern.
Advantages
- This pattern can provide traders with attractive levels to make an entry in a financial instrument.
- Beginners can easily identify this pattern and use it.
Disadvantages
- It is not reliable as a standalone indicator as it often gives false signals. One usually needs to use it with other technical indicators.
- Sometimes, this pattern’s confirmation can delay a trader’s actions.
Bullish vs Bearish Harami Cross
The differences between bullish and bearish harami cross patterns indicator are as follows:
- A bullish harami cross signals a possible upside reversal, while the bearish variant indicates an impending downtrend.
- In the case of the bullish variant, one can observe a large green candle followed by a red doji. On the other hand, the bearish variant has a large red candle followed by a green doji.
For professional-grade stock and crypto charts, we recommend TradingView – one of the most trusted platforms among traders.
Disclosure: This article contains affiliate links. If you sign up through these links, we may earn a small commission at no extra cost to you.

