Table Of Contents
Goodness-Of-Fit Definition
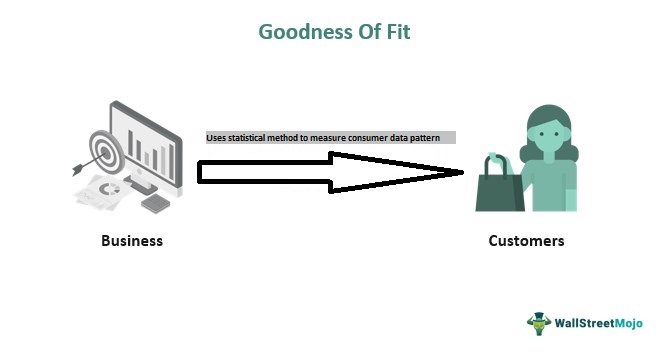
Goodness-of-fit is a statistical method for assessing how well a sample of data matches a given distribution as its population. It derives a comparison of observed values and expected values and explains whether the model developed fits the set of observations.
The goodness-of-fit technique is frequently applied in the business decision-making process. Its application shows whether or not the data fits into the hypothesis model. In other words, it determines whether or not the data corresponds to the predicted outcomes and parameters. For example, it demonstrates how closely manufactured products meet the standards. Good results indicate that the products meet the requirements.
Key Takeaways
- Goodness-of-fit is a statistical method for assessing how well a sample of data matches a given distribution as its population. In other words, the technique is used for checking the accordance between observed and expected data.
- The test types include the Chi-Square test, Kolmogorov-Smirnov (K-S) test, the Anderson-Darling (A-D) test, and Shapiro-Wilk (S-W) test.
- It explains whether a given distribution is suited to a dataset. The techniques are generally applied in business decision-making, social and scientific research.
Goodness-Of-Fit Explained
A goodness-of-fit test is a statistical technique popular for checking the accordance between observed and expected data. It assesses "how well actual (observed) data points fit into a given model." It summarizes the disparity between actual observed and expected data points in the context of a statistical model.
When employed in decision-making, goodness-of-fit tests make it easier to forecast future trends and patterns. Numerous goodness-of-fit indices are presented in the model fit evaluation process to determine whether the model is compatible with the empirical data. The type of data used in the model determines the estimating method to be used. Furthermore, the techniques are generally developed in association with univariate data rather than multivariate data.
Goodness-Of-Fit Tests
Some of the popular tests are the following:
#1 - Chi-Square Test
The chi-square test determines whether a data sample came from a population with a particular distribution. The goodness-of-fit test has the advantage of applying to any univariate distribution. The chi-square test is used to establish or disprove the existence of a link between actual observed and expected values.
For predictive analytics specialists, the chi-squared test is an extremely important tool. It is widely used in social science research and business research. The chi-square goodness-of-fit test is applied to binned data (data that has been classified), and the value of the chi-square test statistic depends on how the data has been classified.
#2 - Kolmogorov-Smirnov Test
The Kolmogorov-Smirnov test is a quick approach to determine whether two samples are significantly different. It is commonly used to test the consistency of random numbers. The statistic measures the distance between the empirical distribution functions of two samples. To test the null hypothesis that the unknown distribution function is a known, specified function, a test for goodness-of-fit usually includes examining a random sample from an unknown distribution.
The Kolmogorov-Smirnov goodness-of-fit test (K-S test) determines whether a dataset and a known distribution have the same distribution by comparing them. It is also used to validate the variance's normality assumption analysis. The null hypothesis is rejected if D is higher than the critical value at alpha. Conversely, D is accepted as the null hypothesis if it is less than the critical value.
#3 - Anderson-Darling Test
The Anderson-Darling test uses a particular distribution to determine critical values. The benefit of this is that it enables a more sensitive test, but the drawback is that critical values are calculated for each distribution.
Furthermore, the Anderson-Darling (A-D) test is a variant of the K-S test that prioritizes the distribution's tails. Moreover, the A-D test is more sensitive to variances seen in the tails, whereas the K-S test is more sensitive to differences that may occur closer to the center of the distribution.
#4 - Shapiro-Wilk Test
The Shapiro-Wilk (S-W) test examines whether or not a sample has a normal distribution. When utilizing a sample with one variable of continuous data, the test merely checks for normality and is recommended for small sample sizes up to 2000.
This test, like the others, employs alpha and generates two hypotheses: null and alternative. The null hypothesis asserts that the sample belongs to the normal distribution, whereas the alternative hypothesis asserts that the sample does not belong to the normal distribution.
Example
Let us look at the goodness-of-fit example to understand the concept better in the following section -
A box contains 100 flowers in 2 different colors. The goodness-of-fit test can be applied to identify whether all the colors occur equally.
Null hypothesis: All colors occur in the same proportion.
The actual values are the number of flowers for each of the two colors. The expected count refers to what we would expect if the null hypothesis were true.
The expected number of flowers in color 1 is F1, and in color 2 is F2.
F1=F2= 1/2
Alternative hypothesis: At least one of the population proportions is not equal to 1/2.
If the null hypothesis were true, the expected counts for each color would be (1/2) x 100 = 50.
Applying the chi-square goodness-of-fit test to analyze the observed and expected proportions obtains the decision on whether to reject the null hypothesis based on the size of the p-value. If the p-value is very small, rejection of the null hypothesis occurs, concluding that flowers are not evenly distributed among the two colors.
