Table Of Contents
What is Free Cash Flow Yield (FCFY)
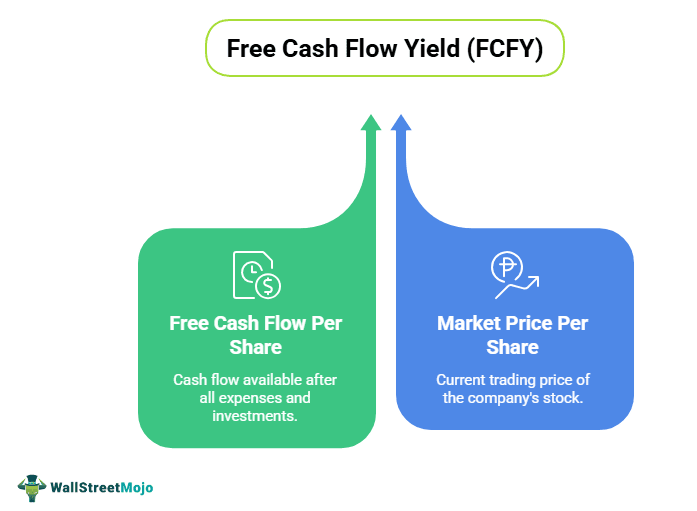
Free cash flow yield is a financial ratio that measures how much cash flow the company has in case of its liquidation or other obligations by comparing the free cash flow per share with the market price per share and indicates the level of cash flow the company will earn against its share market value.

The higher the ratio, the more attractive the investment is since it indicates that investors pay less for each free cash flow unit.
Many stakeholders consider cash flow a more accurate measure of a company’s performance than earnings since cash flow represents a firm’s ability to sustain its operations. Furthermore, free cash flow gives the company flexibility to increase its intrinsic value. One can use the cash left over to pay dividends and interest, reducing debt, acquisitions, and future investments.
Key Takeaways
- Free Cash Flow Yield is a financial ratio that determines the company's cash flow in case of its liquidation or other obligations by comparing the free cash flow per share with the market price per share.
- It shows the cash flow level the company may earn against the share market value.
- The equity shareholders and a firm perspective may evaluate the Free Cash Flow Yield.
- It is a crucial financial tool that clarifies the firm's financial health more than net income. Moreover, it is valuable regarding the value received against the investment.
Calculation of Free Cash Flow Yield (FCFY)
The equity shareholders and a firm perspective can calculate free cash flow yield. However, while computing free cash flow yield, we must ensure that the denominator and numerator are consistent with the firm or equity value.

Formula #1 (FCFE)
From the perspective of common equity holders, the free cash flow yield calculation is as follows: -
- FCFY= Free Cash Flow to Equity (FCFE) per share/Market Price per share
- Where FCFE = Net Income + Non-recurring expenses - Non-operating income + Non-cash operating expenses – Equity Reinvestment
Non-cash operating expenses are added back since they are accounting expenses but not cash expenses. Further, non-recurring or non-operating income/expenses are excluded to derive recurring cash flow from core operations. Finally, for maintaining consistency in calculations, equity reinvestment needs are subtracted from the gross cash flow to arrive at free cash flow available to equity holders.
Equity Reinvestment= (Capital expenditure – Depreciation) + change in non-cash working capital – (new debt issue – debt repayment) - (new preferred stock issued – preferred dividend)
Net capital spending is considered to arrive at the net cash outflow from investment in fixed assets. Again, since the increase in the working capital drain a firm’s cash flows while the decrease in working capital frees up available cash flows, we are concerned with cash flow changes due to changes in working capital. To the extent the firm finances this reinvestment by a mix of equity, debt, and preferred equity, debt holders’ and preferred shareholders’ investment within this total reinvestment are subtracted to arrive at net reinvestment by equity.
Formula #2 (FCFF)
Free cash flow yield calculation from a firm’s perspective (equity holders, preferred shareholders, and debt holders) is as follows: -
- FCFY= Free cash flow to firm (FCFF) /Enterprise Value
- Where FCFF = FCFE + Interest expense (1- tax rate) + (principal repayments –new debt issued)+ Preferred dividend
- And Enterprise Value= Market Capitalization of equity+ Market value of preferred equity + Debit – Cash
From a firm’s perspective, this calculation represents free cash flow left to all claim holders against the investment made. Here, the investment is depicted by the enterprise value, which is the market value of investments by all the firm investors, while the market capitalization of the portion owned by shareholders.
Since we are considering all claim holders, we need to add to FCFE all the payments made to lenders and preferred shareholders like interest expense, net debt repayments, and preferred dividend.
A simpler way of calculating FCFF is by subtracting capital expenditure from the operating cash flow found in the cash flow statement.
- FCFF= Cash flow from operations – capital expenditure
Video Explanation Of Free Cash Flow Yield (FCFY)
Example of Free Cash Flow Yield (FCFY)
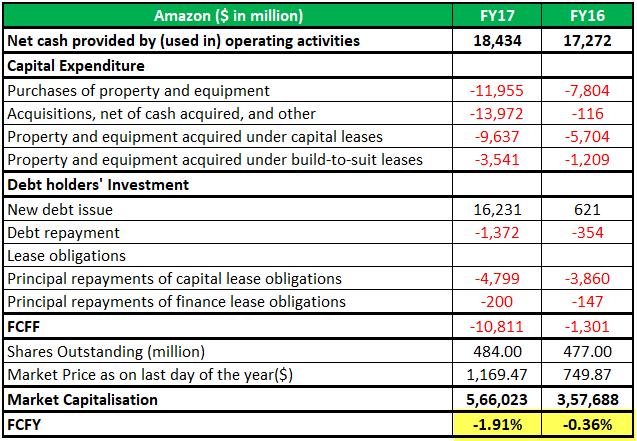
In the case of Amazon, when considering the property and equipment acquired under capital and built-to-suit leases, trailing twelve months, FCFY is negative despite the company showing a positive cash flow of $1.2 billion and $3.4 billion for FY17 and FY16, respectively, in the cash flow statement.
Table 1: FCFY calculation for Amazon

Source: FY17 Annual Report, Amazon
FCFY Comparision
Investors who consider cash generation by a firm to better represent its operations like analyzing the cash flow statement. For them, FCFY is a more appropriate indicator against the P/E ratio or EV/EBITDA ratio since cash flow is a better return representation. One can manipulate revenue and earnings, but firms cannot manipulate cash flows. For example, corporate share buybacks can superficially improve earnings per share.
Higher the amount of free cash flow, the greater the flexibility of the company to pursue growth opportunities during good times and smoothly tide over difficulties during bad times. A company with a steady free cash flow yield can consider dividend payments, share buybacks, inorganic and organic growth opportunities, and debt reduction. Thus, cash flow yield provides a better indication of long-term valuation.
Table 2. Comparison Across Companies - FCFY

A look at Table 2 reveals that while Alphabet remains the most attractive stock based on the difference between forward P/E ratio and current P/E, Apple remains a safer bet considering its high free cash flow yield. A more relevant measure would be to check the forward FCFY for better decision-making. However, comparing companies within the same industry is more important while doing the relative valuation.
Conclusion
Free Cash Flow Yield (FCFY) is an important financial metric that provides a more vivid picture of the firm's financial health than net income. This ratio is valuable as it relates to the value received against the investment made. Compared to its assets, a company with a high cash flow may be overpriced in the market, leading to a lower FCFY and vice versa.
FCFY helps in analyzing the strength of a firm. A negative free cash flow yield or negative free cash flow may indicate that the firm is not liquid enough and would need external funding to continue its operations. The continuous decline in free cash flow may impact future earnings growth. In contrast, rising free cash flow allows companies to self-finance without costly external financing for development, thus shareholder value. However, FCFY cannot alone be considered the only metric for making investment decisions. Firms in the high growth phase may have decent earnings, but their cash flows may get fully consumed by the Capex definition. Hence, these firms may report lower FCFY despite promising growth prospects.

