Table of Contents
What Is Forex Chart Patterns?
Forex chart patterns are technical indicators that help traders determine the trends in the forex market and look for opportunities to enter a profitable trade. There are a number of such patterns widely used in the market.
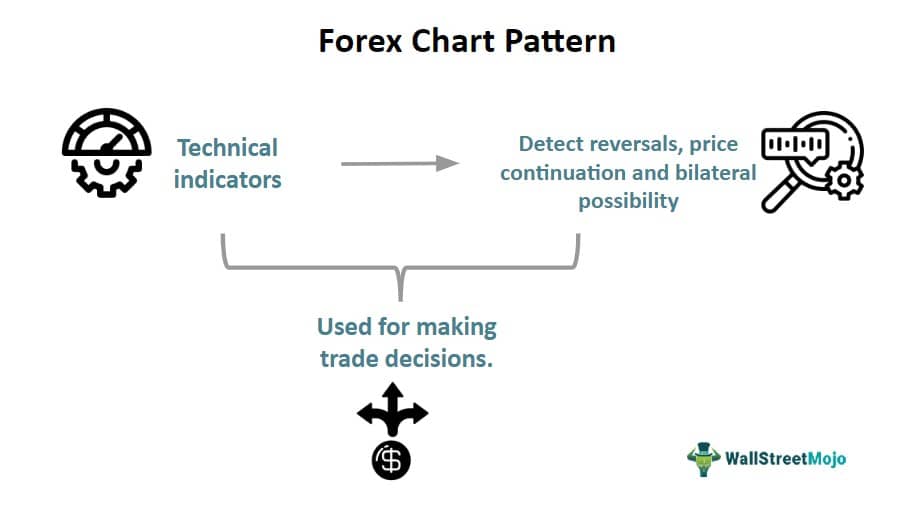
These patterns indicate that the market actions get repeated based on market sentiments, volatility, and socioeconomic conditions. Through these patterns of indicators, traders can estimate future market movements and plan their trades accordingly. The article elaborates on some commonly used indicators in the forex market.
Key Takeaways
- Forex chart patterns are indicators used in technical analysis that suggest to traders the forex market movements and help them decide on their future course of action.
- These indicators show market volatility, trends, and overall sentiments of the market participants.
- They commonly include reversals and continuation patterns and also indicate if there is a possibility of high volatility and movement in both ways, upwards and downwards.
- Analysis using these powerful tools helps traders trade with minimum risk.
Forex Chart Patterns Explained
Forex chart patterns are technical analysis indicators that guide investors and traders regarding the market condition and help them identify profitable trading opportunities. Such patterns may be used for short-term or long-term trading and commonly appears in any charting platform. They can be set according to the trader’s preference so as to achieve the best results.
Such best forex chart patterns are simple to use and interpret. However, skill and experience make it easy to identify them within the chart, providing signals for profitable trade. They typically show trend reversals and also continuation patterns along with a volatile picture of the market, where prices may move either up or down.
Different trading forex chart patterns are suitable for and appear in different types of markets, but it is important to understand what each of them conveys so that traders can identify and use them as and when they appear. Each of them is equally important and convey various intricacies of the market. Each of those patterns are elaborated below.
Types
Given below are the types of such trading forex chart patterns that are commonly used in the forex market.
#1 - Head and Shoulder pattern
As the name suggests, the pattern takes the form of a head with two shoulders on both sides. Both the above patterns are displayed in the charts below, taken from TradingView.
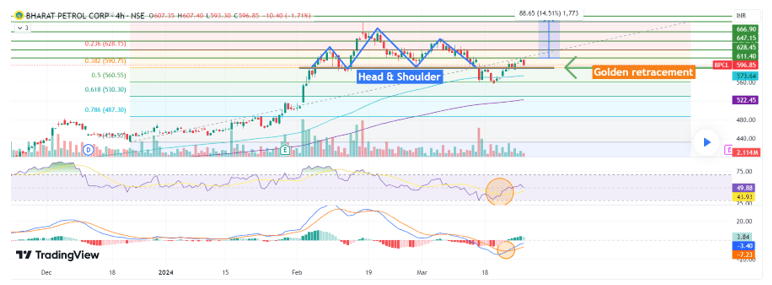
It can appear both at the end of an uptrend and a downtrend. The former suggests that an uptrend is about to end. The candlestick arrangement initially forms higher highs, then retraces, again forms higher highs, whose peak is higher than the previous one, followed by a retracement and, finally, the third high, whose peak level is similar to the first one. After that, the prices show a downward move.
When this pattern appears at the end of a down move, it is called an inverted head and shoulder, whose price actions are just the opposite of the previous one, as given in the chart below.
Inverted Head and Shoulder
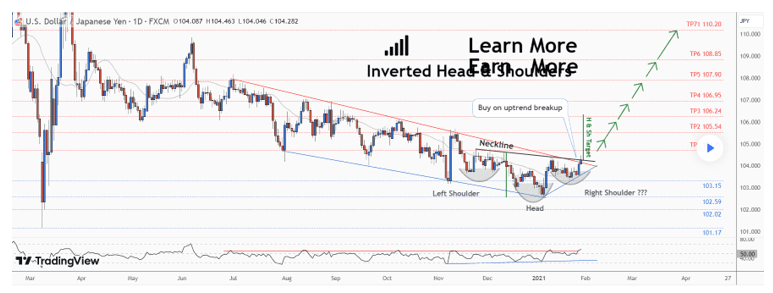
Both these patterns provide signals for entry, exit, stop loss, and profit target price. Therefore, they are widely used and best forex chart patterns. Typically, the entry is at the neckline level, and the stop loss is just below or above the right shoulder, depending on the market trend.
#2 - Ascending, descending and symmetrical triangles
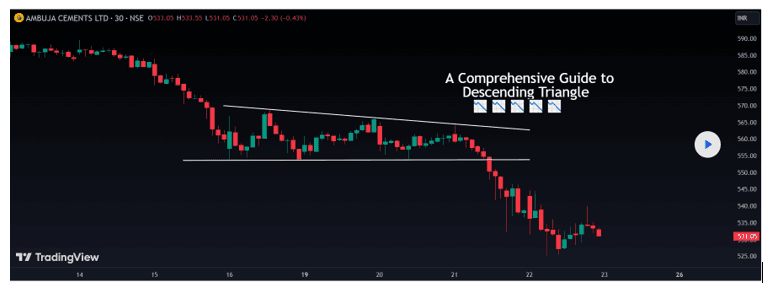
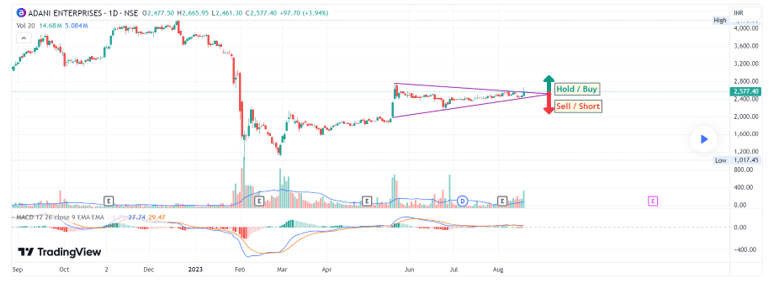
Triangles are formed when the prices form upper and lower trend lines, where the upper line forms lower highs and the lower line forms upper highs, and both of them slowly converge or meet at a certain point. In the case of an ascending triangle, the pattern is facing upwards, suggesting an uptrend in the future. Therefore, they are reversal patterns. The chart given below shows the pattern.
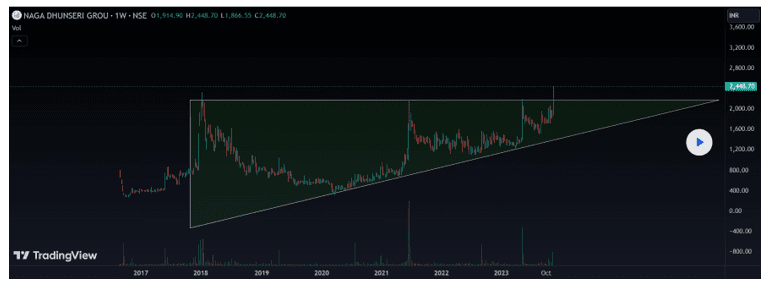
A descending triangle will typically face downwards, signaling a down move or downtrend soon, as depicted in the chart below.
A symmetrical triangle will show consolidation and is considered a continuation pattern in the technical analysis. After the trend lines merge at a certain point, the prices may move in any direction. Therefore, it does not show any clear trend.
#3 - Engulfing Patterns
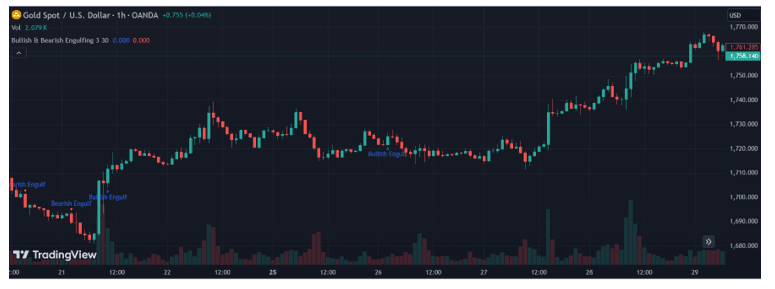
The engulfing patterns are those candlestick arrangements, where one candle completely engulfs the previous one to form a reversal trend in the future, among other free forex chart patterns. The bullish engulfing pattern is the one where a big green candle completely engulfs the previous red candle, suggesting a bullish trend in the future. The opposite will happen in the bearish engulfing pattern. Both the patterns appear in the chart given below, where the formations are clearly mentioned. They are reversal patterns, too.
#4 - Flag Patterns
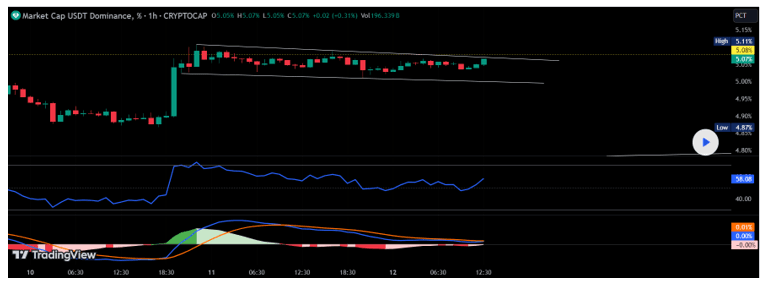
Here, the formation is such that it depicts a pole with a flag on top. This can be a bullish or bearish flag. A bullish flag will be tilted downwards, and has the possibility of an uptrend, and the bearish flag will tilt upwards, signaling a downtrend in the future. They are considered reversal patterns in the market.
Bullish Flag Pattern
Bearish Flag Pattern
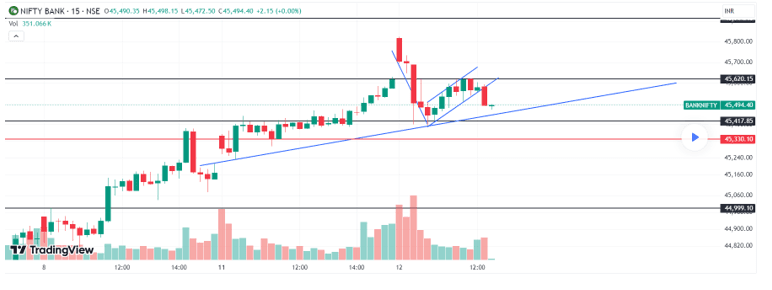
#5 - Double Top
A double top is an M-shaped candlestick pattern in which two consecutive tops are created at almost the same price level with a decline in between. It is a trend reversal pattern, where the prices are expected to fall after they fall below the support level. Thus, it suggests that the bullish trend is about to end.
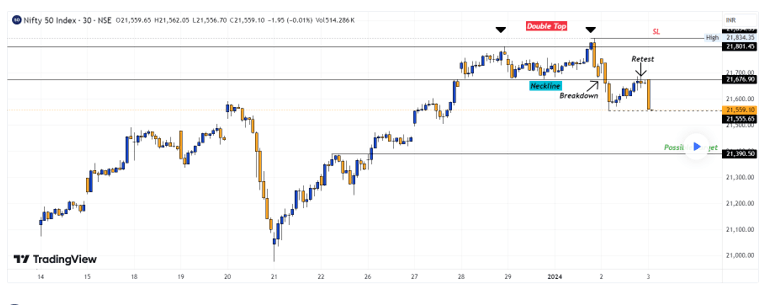
#6 - Double Bottom
A double bottom is a W-shaped candlestick pattern in which there are two consecutive bottoms created at almost the same price level with a rise in between. The interpretation of this pattern is just the opposite of the double-top pattern.
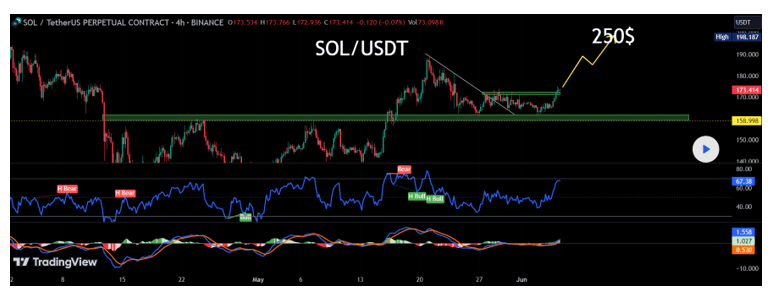
#7 - Wedge pattern
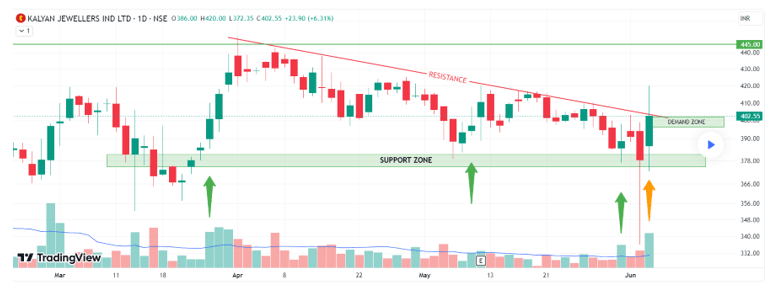
This pattern is similar to a flag, but the trend lines do not run parallel to each other, like a flag. The trend lines meet each other at a point. A rising wedge denotes a downtrend in the future, and a falling wedge denotes uptrend, when the price will break the resistance. The charts explain the concept.
Rising Wedge
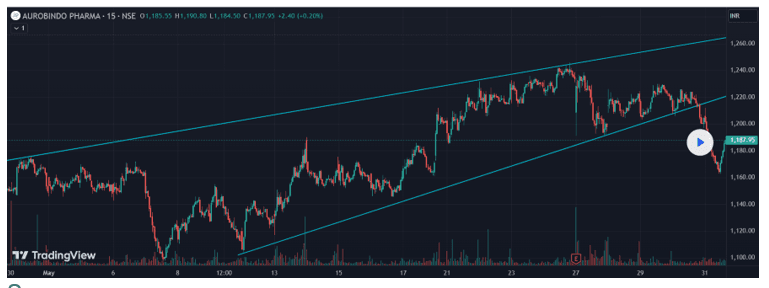
Falling Wedge
#8 - Cup and handle
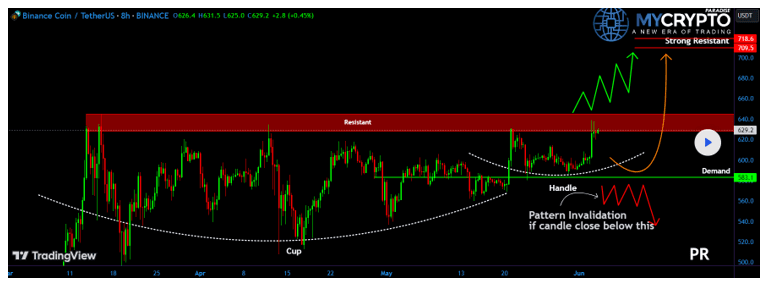
In this pattern, which is also a reversal indicator, a cup-like round bottom candlestick arrangement is seen along with another dip on the right side of the cup, which usually comes down to about 50% of the depth of the cup. It depicts the beginning of a possible uptrend in the future. The chart given below shows the formation.
How To Use Chart Patterns For Trading?
In order to trade in the forex market using the above different forex chart patterns, it is important to have a good understanding of each and what they depict when they appear in a chart. This will help the trader to use it for identifying profitable trades after forecasting the market. This process needs skill and experience.
None of the different forex chart patterns are such that they can be used as a standalone indicator. They often give false signals and breakouts that misguide the trader. Therefore, they should be used in combination with other technical indicators for better confirmation.
Risk management plays a huge part in forex trading. Setting proper stop loss and deciding on the profit targets before taking a trade is very important so that the trader already has a strategy in place in case the market does not go in the desired direction.
Each of the above free forex chart patterns is meant to signal different trading approaches and decisions. Traders should understand this and accordingly decide the future course of action. Before going ahead with the trade, it is a good idea to check the ratio of reward to risk. A higher ratio is always desirable because it means the possibility of return is more than the risk of loss.
For professional-grade stock and crypto charts, we recommend TradingView – one of the most trusted platforms among traders.
Disclosure: This article contains affiliate links. If you sign up through these links, we may earn a small commission at no extra cost to you.

