Table of Contents
Forecasting Accuracy Definition
Forecasting accuracy refers to the precision of a company's sales prediction. It shows whether the sales team has been able to predict its sales performance correctly within a specific period. Hitting a sales forecast figure gives more clarity to the company's decision-makers. It can help them budget correctly without having to guess an appropriate figure.
A precise forecasting accuracy calculation gives more character to the processes within the organization. Its significance is multifaceted. Managers and other top-level leaders can make data-driven decisions, set goals, hire, and concentrate on revenue-generating core business activities. The three main formulae used in this regard are the mean absolute, mean absolute percentage and root mean square error formulas.
Key Takeaways
- Forecasting accuracy is the prediction of the demand for a particular metric in comparison to the actual performance. For instance, sales teams forecast demands and compare them with actual sales to determine deviations.
- It is one of the most significant factors that allow businesses to minimize their costs, meet customer demands, and optimize their operational activities.
- Even internally, it gives the leaders of the business an idea of their requirements to meet future demands. As a result, it helps with accurate budgeting, inventory planning, and resource allocation.
- Due to the precision, companies improve their performance and overall financial well-being.
Forecasting Accuracy In Sales Explained
Forecasting accuracy is a metric that signifies the correctness of a demand forecast in comparison with actual sales. It also validates an organization's forecasting system. Forecasting accuracy measures provide companies with a detailed insight into their stock levels, sales, and other related numbers.
One common misconception in the business world is that forecasting is perceived as the end of a process or analysis. However, the opposite is true. Once an accurate system is ascertained, it can act as the basis for achieving other related goals of the organization. In fact, many factors, external and internal, have to fall into place for the prediction to be on point.
A lot of business and life in general are lived and executed based on an anticipation of future outcomes. Therefore, companies investing a significant amount of time, resources, and effort into incorporating a system that gets them to a desired future figure is no surprise. In fact, executives, investors, and sales teams make many crucial business decisions based on these predictions.
Forecasting accuracy also shows investors and other stakeholders that the company knows its financial and operational standpoint in its factuality. It means that the company has thoroughly researched upcoming trends, has an exemplary financial planning system, and efficiently allocates its resources.
Formula
The three formulas that contribute to forecasting accuracy metrics are mean absolute error, root mean squared error, and mean absolute percentage error.
1. Mean Absolute Error (MAE) = (1/n) * ∑|Actual Sales – Forecasted Sales|
Here,
- N = Total number of observations
- ∑ = summation symbol. It signifies that actual and forecasted figures’ absolute difference must be added
- |Actual Sales – Forecasted Sales| = Absolute difference between forecasted and actual sales at each data point.
2. Root Mean Squared Error (RMSE) = √
Here,
- N = Total observations
- (Actual Sales – Forecasted Sales) ^ 2 = The dissimilarity between actual and forecasted sales must be added
3. Mean Absolute Percentage Error (MAPE) = (1/N) x ∑((Actual Sales – Forecasted Sales) / Actual sales) x 100
Here,
- N = total Observations
- ∑ = The absolute percentage difference between forecasted and actual sales should be summed up.
How To Measure?
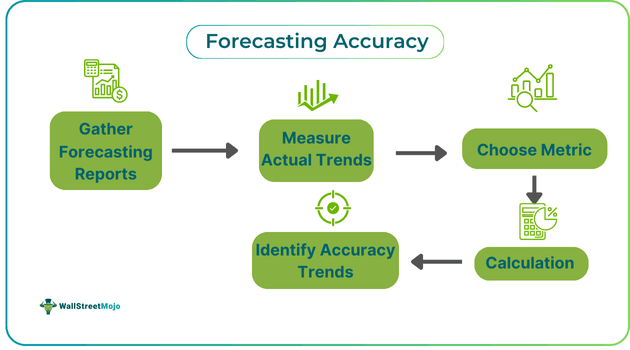
Below is a step-by-step process that helps with measurement and forecasting accuracy calculation.
- Forecast Gathering: The ideal way to gather forecasting reports is to collect them for a specific period. For instance, if a company wants to review its quarterly reports, it can pull up reports for each month within the quarter. A forecasting team or an inventory manager is responsible for compiling these reports.
- Actual Trends Measurement: After the forecast figures for the period are obtained, the leadership team can compare them with actual performance data. For instance, the demand forecast can be compared with the sales data for the same period. As a result, the consistency and preciseness of the forecast can be observed.
- Metric Choice: The two most common metrics that provide valuable insights into such comparisons are Mean Absolute Percentage Error (MAPE) and Mean Absolute Deviation (MAD). To maintain uniformity of analysis, these metrics must be used consistently across all reviews of forecast and actual performance.
- Calculation: Once a metric is decided upon, the managers can calculate it using spreadsheet software or customized company software that applies the pre-determined formula.
- Accuracy Trends Identification: It is helpful in continually identifying the accuracy of the company's pre-empted demand or other such figures. The results of these reports must be shared with all stakeholders to ensure the successful track record is sustained or to improve precision.
Examples
Now that the theoretical aspects of the concepts are well-established, it is time to address the practical applications of forecasting accuracy measures. The examples below shed light on this.
Example #1
The following data signifies the forecasted and actual sales data for Q1 of ABC Enterprises:
| Month | Actual Sales | Forecasted Figure |
|---|---|---|
| Month 1 | 60 | 50 |
| Month 2 | 50 | 45 |
| Month 3 | 80 | 90 |
ABC Enterprises uses MAPE to find the differences between their forecasted and actual figures. Therefore:
Mean Absolute Percentage Error (MAPE) = (1/N) x ∑((Actual Sales – Forecasted Sales) / Actual sales) x 100
- Month 1 = ((60-50)/60) * 100 = 16.6%
- Month 2 = ((50-45) / 50) * 100 = 10%
- Month 3 = ((80-90)/80) * 100 = 12.5%
Subsequently, the average error value was calculated:
MAPE = (1/3) x ∑(16.6 + 10 + 12.5) = 13%
Example #2
Computing hardware systems are among the most in-demand products globally. However, manufacturers must forecast demand as precisely as possible to manage inventory, enhance customer service, and reduce operational costs. These manufacturers faced multiple challenges as the reports were almost never accurate.
Therefore, High-Performance Computing (HPC) was applied. It reduced forecasting errors by a staggering 70-100%. As a result, potential inventory was reduced by 7%, which translated to approximately $300 Million in savings.
How To Improve?
While incorporating forecasting accuracy metrics, inevitably, results will be vague. However, there are a few measures that can be taken to ensure that the accuracy is improved. A few of the most prominent ones are:
- Forecasting must be broken down into small and straightforward steps. A dedicated person must perform each step to ensure everyone is clear about their role in the process.
- Documentation of each step shall give the sales team and the business at large a clear understanding of opportunities, closed deals, and qualified leads.
- A consistent set of metrics must be used to ensure sustained uniformity. Historical forecasting, length of sales cycle forecasting, and intuitive forecasting are a few of the most common forecasting methods.
- Automated forecasting tools are also available to improve the report's precision by using real-time tracking methods. This ensures that all risks are accounted for and mitigation ideas are provided to tackle them.
Importance
There are a variety of reasons why forecasting accuracy calculations are essential. A few of the most noteworthy ones include:
- A system that gives businesses a precise forecasted figure gives them enough time to prepare for the future. For instance, based on accurate demand forecasts, businesses can budget and allocate enough money to fund production to meet the demand.
- The role of risk management in business is well-established. Forecasting the risks of different business facets helps businesses develop backup plans and predict potential risks well in advance.
- Proper prediction allows the business to meet customer demands on time, increasing customer satisfaction and loyalty.
- Companies that have a clear future vision tend to have a competitive advantage over their competitors and the industry in general.
- Since reliable forecasts give businesses a well-established system and enough time to execute plans, they are directly tied to significantly better financial performance.
