Table Of Contents
FORECAST Function in Excel
The FORECAST function is categorized under statistical functions in Excel. The FORECAST function calculates or predicts the future value based on existing values. Therefore, we can use the FORECAST formula to calculate the statistical value of a forecast made.
For example, if we know the past data, such as currency flow, we can forecast the future flow using the function.
In mathematical terms, the FORECAST(x, known_y’s,known_x’s) function returns the predicted value of known_ys for the specific value x of the independent variable known_xs by using a best fit linear regression to predict y values from x values.
FORECAST Formula in Excel

The FORECAST formula in Excel has three critical parameters: x, known_y’s, and known_x’s.
Compulsory Parameters:
- x: A numeric x-value for which you want to forecast a new y-value.
- known_y’s: An array of the dependent variable or range of data.
- known_x’s: The independent array or range of data known to us.
Remarks
The FORECAST formula will calculate a new y-value using the simple straight-line equation:

Here, a and b are the sample means calculated by average (x values) and average(y values).
How to Use the FORECAST Function in Excel?
The FORECAST function in Excel is very simple and easy to use. Let us understand the working of the FORECAST function in Excel with some examples.
The FORECAST formula in Excel can be used as a worksheet function and a VBA function.
The FORECAST function as the Worksheet function.
Example #1
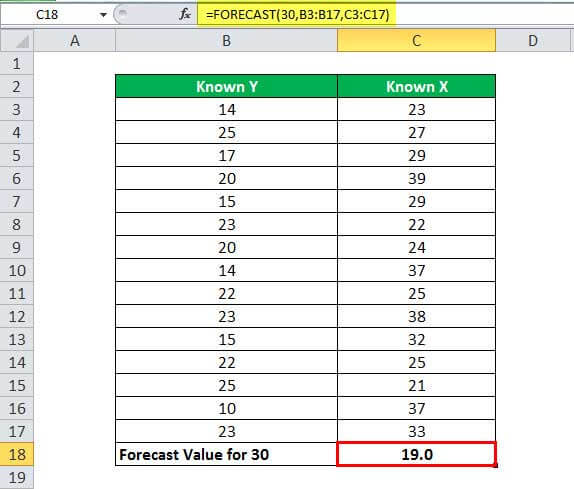
In this FORECAST example, let us consider datasets for known y’s and known x’s values and calculate a forecast value for 30 based on known values x’s and y’s.
=FORECAST(30,B3:B17,C3:C17) output will be 19, as shown below.
Example #2
Suppose we have the earnings and expenses data from 2017, as shown in the table below. Here, earning data is known as x’s value, and expenses data is known as y’s value. We can use the FORECAST function to predict an additional point along the straight line of best fit through a set of known x- and y-values. Using the data below.
Using earnings and expenses data from January 2017 to August 2017, we can predict the expenses for the upcoming month using the FORECAST function in Excel. In this FORECAST example, we expect the forecast value for Sept 2018 using the FORECAST function in Excel.
The FORECAST formula in Excel to use in this example:
=FORECAST(C43,C23:C42,D23:D42)
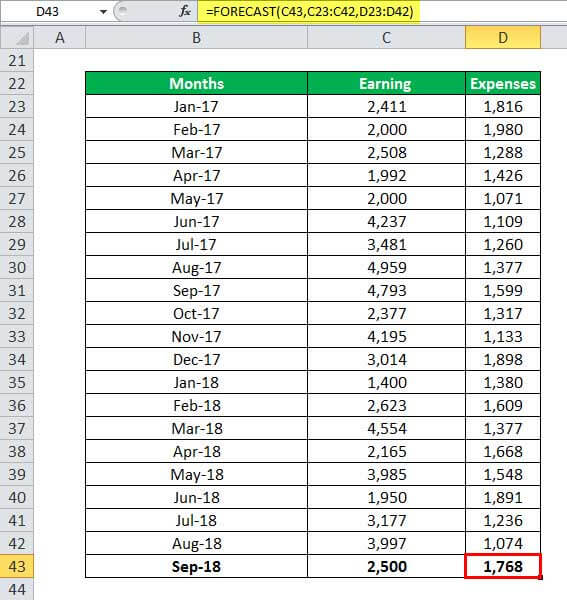
We get the results as 1,768.
The FORECAST function can be used as a VBA function.
Let us consider a data set with x values from A1:A5 and y values from B1:B5.
Sub FORECASTfunction()
Dim xs As Range
Dim ys As Range
Set xs = Sheets(2).Range("A1:A5")
Set ys = Sheets(2).Range("B1:B5")
Sheets(2).Range("H1").Value = Application.worksheetFunction.Forecast(50, ys, xs) // note 50 is a random for testing
End Sub
Things to Remember
- The length of the known_x’s array should be the same as the known_y’s, and the variance of the known_x’s must not be zero.
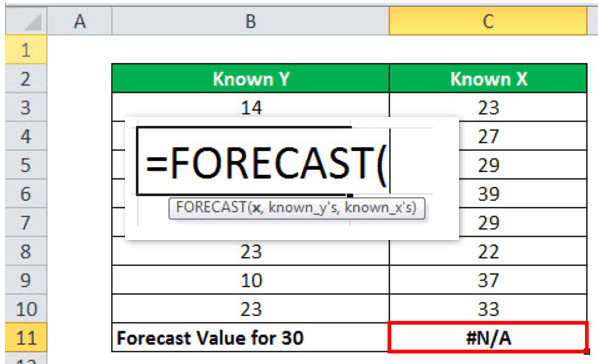
- It will give a #N/A! error if:
- The supplied values known_x’s and the supplied known_y’s arrays are different in lengths.
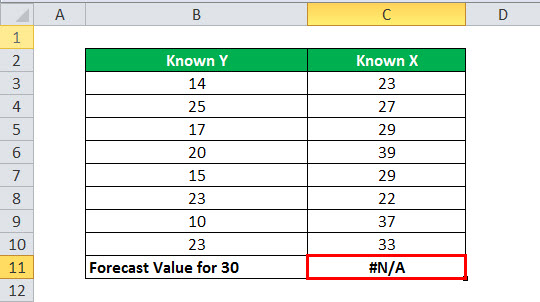
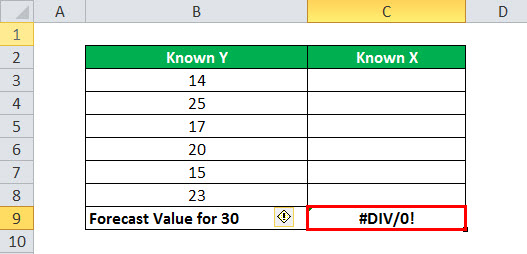
- It gives the #DIV/0! Error when
- One or both of the known_x’s or the known_y’s arrays has no value or is empty.
- If the variance of the supplied known_x’s is equal to zero.
- The given future value of x is non-numeric.
