Table Of Contents
What Is A Flash Report?
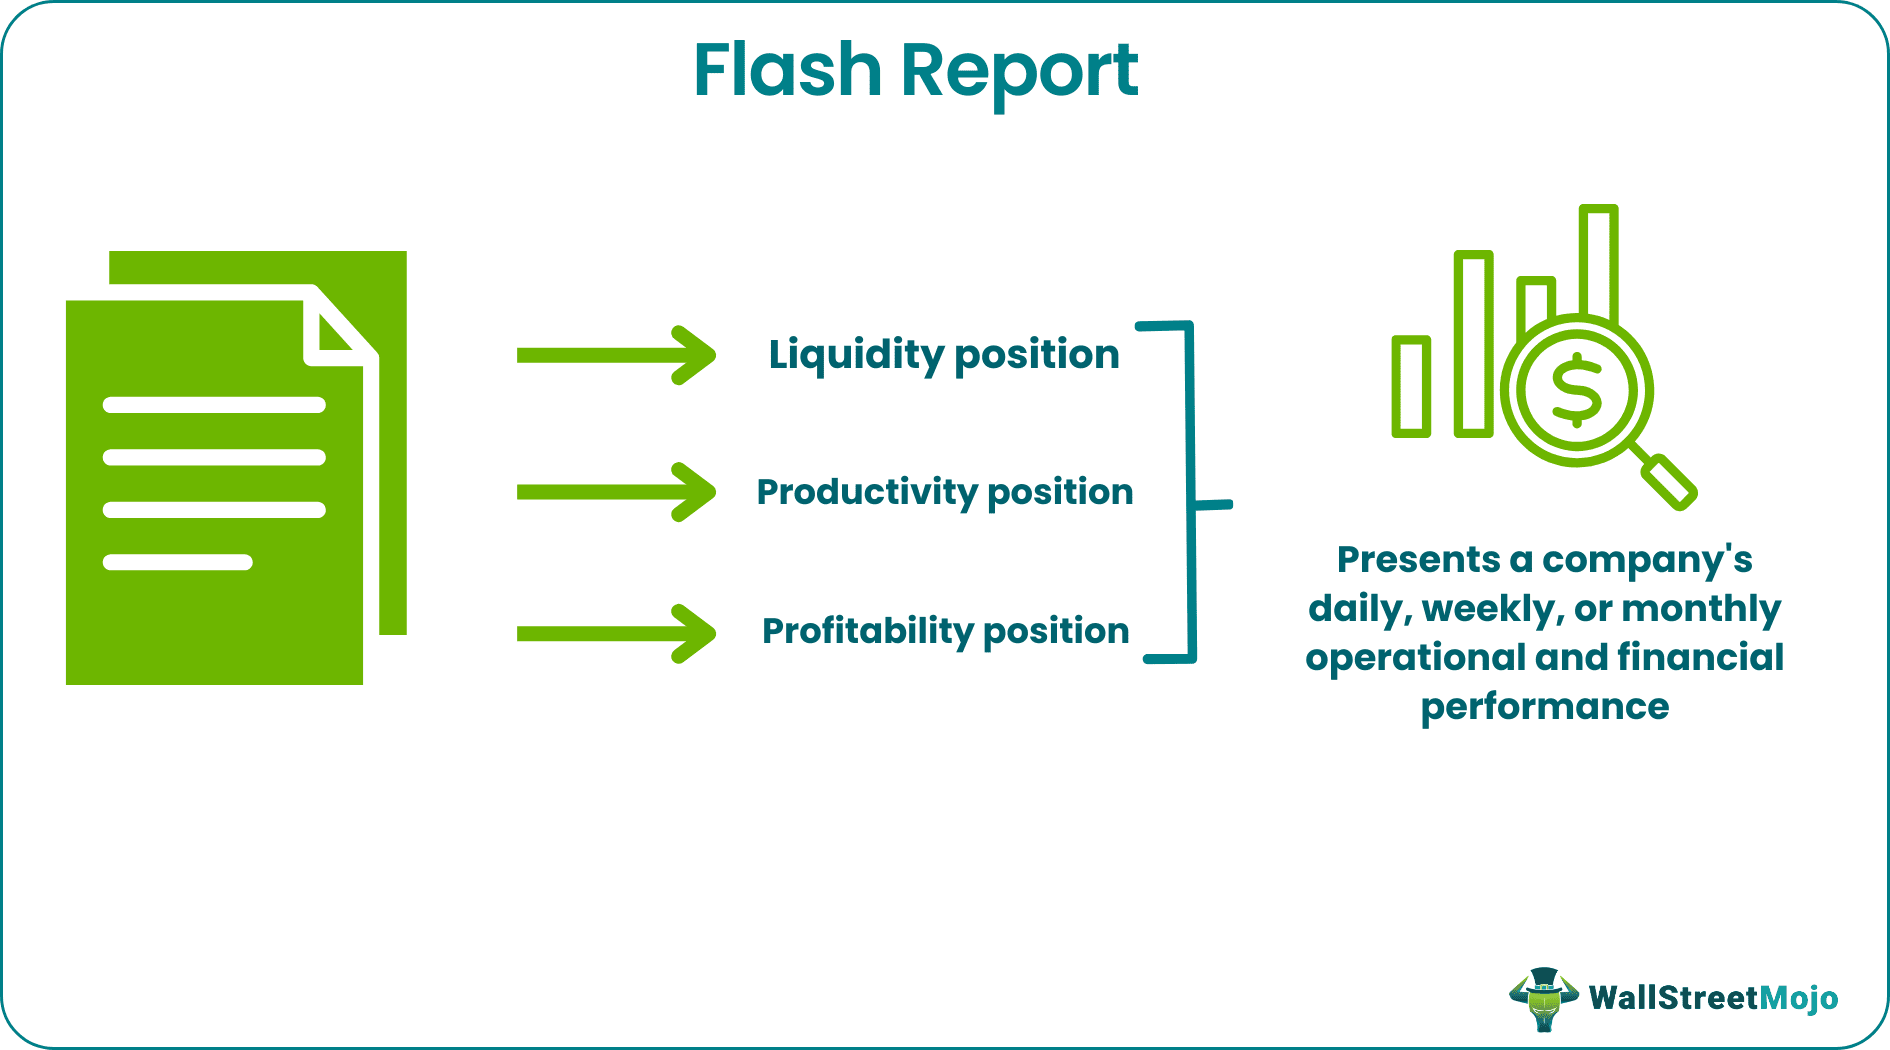
A Flash Report is a synopsis generated by internal teams to present a company’s operational and financial performance on a daily, weekly, or monthly basis to the management. It summarizes business information, operating data, and Key Performance Indicators (KPIs) to highlight areas that require immediate action.
Top-level executives review these reports periodically to understand how profitable the business was in a given period. They use these reports instead of waiting for quarterly financial statements to make timely decisions. Such performance snapshots are critical for C-level executives to identify operational pitfalls and take corrective actions accordingly. Hence, flash reporting serves as a preventive measure that saves companies from massive potential losses.
Key Takeaways
- A flash report or dashboard report is a quick summary of a company's operational and financial performance. It is prepared on a daily, weekly, or monthly basis, depending on business needs.
- It serves as a critical tool for top and middle management executives, helping them identify key problem areas. Based on such input, they can make suitable decisions to boost revenue and maintain profitability.
- The three sections of a flash report are liquidity, productivity, and profitability.
- There is no standard format for creating such a summary; a company can design its flash report based on its business type, requirements, and objectives.
Flash Report Explained
A flash report serves as a key tool to improve business processes and performance in the long run. However, it is efficient only when it is prepared and updated timely to reflect the current scenario. While there are many flash report samples teams (accounting, finance, sales, marketing, etc.) can use as a reference point for developing a format that suits their organization the best, effective reports have the following characteristics:
- Simple to read or interpret;
- Short, usually summarized on a single page, containing graphs, tables, and one-liners, and
- Comparable, i.e., facilitating the comparison of actual outcomes with the budgeted figures or corresponding numbers from a previous period of operations.
Dashboard reports serve diverse needs and purposes within a company. The objective of such summaries depends on their use and the department that requires this information for planning and decision-making. Common flash reports include general ledger, accounts receivables, accounts payable, inventory, payroll, senior/middle management, and job cost.
It must be noted that these reports may not be entirely accurate at all times. Even if a report offers decision-makers correct information, adding up to around 80-90%, it can facilitate decision-making. Such reports can still help management avoid complex situations that arise from overlooking or missing facts in the short run. Moreover, businesses can use it as a robust tool to identify short-term market trends or changes and capitalize upon such opportunities.
How To Create?
A flash report should be precise, informative, comparable, and easy to read. Some of the prominent steps in preparing an effective dashboard report are listed below.
- Select a Title: A flash report should always begin with a title that best explains what needs to be discussed further. It should contain the company name with the report's objective.
- Identify Key Metrics: Next, one should determine the related operational and financial metrics corresponding to the areas for which performance analysis is needed. These metrics should be clearly stated in the report.
- Ascertain Frequency: It is essential to decide on a reporting period, which can be daily, weekly, or monthly.
- Set Targets: A benchmark fixes a point of reference for comparing the actual performance targets with targets achieved. For instance, a budget for sales, income, and expenses can be used to define targets and review the numbers eventually achieved.
- Make Comparisons: Another critical step is to place the actual performance numbers parallel to the budgeted figures to facilitate comparison and analysis. Also, depending on business objectives, the performance of a given period can be analyzed against the performance of the same period in the previous year, month, or week.
- Use Standard Accounting and Financial Database: A flash report should be in alignment with the financial and accounting database, methods, and practices followed for periodic financial reporting. This helps ensure adherence to accounting regulations.
- Enhance Visuals: It is important to support flash reports with relevant visuals like graphs and tables that provide critical insights at a glance.
Sections
A company can create a customized dashboard report depending on its business type, requirements, and goals. The team responsible for issuing a daily, weekly, or monthly performance summary can also browse various sample flash reports to understand how to prepare them.
For instance, project flash reports are known to offer key insights into a company’s project efficiency, productivity, and profitability, and several sample reports are freely available to guide executives.
The standard categories or sections in such reports are discussed below.
- Liquidity: This part of the report emphasizes the cash flow position of the company through various KPIs like the accounts receivable turnover ratio, acid test ratio, inventory turnover, and operating cash flow status.
- Productivity: The operational efficiency of a business often influences its financial health. Thus, this section covers KPIs like sales growth, overtime hours, input-linked output, and utilization rate, among several other things.
- Profitability: The profitability section provides an overview of the current earnings through the various KPIs, including the company's gross profit margin, net profit margin, operating margin, and cash flow margin.
Examples
Various types of flash reports are used, and they can be customized or modified based on the objectives of the activity for which they are needed. Hence, companies typically follow independent internal processes while preparing or compiling them. Let us study some examples of how companies use such performance summaries to make decisions.
Example #1
Suppose Prosperity Compass is an insurance company. Its accounting department prepares daily flash reports to track the revenue generated by its sales team. When the report reaches the sales manager, Selena, she notices that the company's sales have consistently fallen in the last 15 days. Thus, she calls an immediate meeting of the team leaders to discuss the issue and find a way out.
Before Selena goes into the meeting, she studies every sales flash report for the past 3 months to compare performance over a period and determine the exact causes for this decline. Once Selena has all the information she needs to prepare a robust action plan, she meets with the team leaders and proposes a new strategy to boost sales.
In this way, Selena used the daily flash reports to make crucial decisions about revenue and profitability.
Example #2
Suppose Frost Me In Sugar is a bakery with 3 stores in Texas. It prepares a weekly flash report to analyze the revenue and performance of all its retail stores. The critical points of the report are shown below:
| Key Performance Indicators (KPIs) | Actual | Budget | Deviation |
|---|---|---|---|
| Store 1 Weekly Revenue | $8400 | $9000 | -$600 |
| Store 1 Weekly Operating Income | $1680 | $1800 | -$120 |
| Store 2 Weekly Revenue | $6200 | $6000 | $200 |
| Store 2 Weekly Operating Income | $1240 | $1200 | $40 |
| Store 3 Weekly Revenue | $11600 | $12000 | -$400 |
| Store 3 Weekly Operating Income | $2320 | $2400 | -$80 |
Angela, the bakery owner, analyzes these reports every week. From the above table, she can see that stores 1 and 3 have generated less than the expected revenue and income, while store 2 has outperformed and surpassed the defined targets.
Angela discusses the issue with the store managers of 1 and 3 and asks them to conduct a Root Cause Analysis (RCA) to identify the reasons for underperformance. Angela guides them on the steps they can take to increase the revenue, and soon enough, stores 1 and 3 also begin to perform well.
In this way, Angela used weekly flash reports to identify problems and fix them within a set time frame to maintain her venture’s overall profitability.
Advantages And Disadvantages
The effectiveness of a dashboard report often relies upon the management's ability to gain insights from such summaries and implement changes for betterment. However, flash reports bring the following specific benefits and limitations.
Advantages:
A flash report is crucial for quick business decision-making. Some other benefits are:
- Real-Time Information: The dashboard reports offer current insights into the company's finances and operations. It is updated daily, weekly, or monthly to ensure real-time information.
- Focused on KPIs: As this summary highlights the key performance indicators pertaining to income, expenses, sales, and other operational aspects, it enables managerial decision-making.
- Proactive Approach: Such documents clearly outline the problem areas. Hence, management can take action and address issues on time.
- Increased Accountability: With frequent updates on the company's financial and operational health, management can be held accountable, particularly by external stakeholders, for any significant challenges arising due to inaction or indecisiveness.
- Effective Communication: Though such documents are collated and presented in just a couple of pages, they can efficiently offer an accurate picture of business performance.
- Versatile and Customizable: Such a report can incorporate any information pertaining to sales, profit, finance, etc. Also, companies can tailor the formats for reporting to their needs and objectives.
Disadvantages:
Let us now discuss the various limitations pertaining to the creation, use, and interpretation of flash reports.
- Frequent Updates Required: Since such reports contain daily, weekly, or monthly updates of a company's performance, they need to be more frequently updated compared to quarterly or annual reports.
- Excessive Workload: Regularly updating these reports increases the workload and burden of the department in charge of preparing such reports.
- Possible Inaccuracies: Dashboard summaries must be devoid of errors or biases to ensure their fair use for managerial decision-making. However, such discrepancies may creep in despite caution.
- Possible Misinterpretation: If managers do not read and analyze the numbers in the right or suitable manner, it may lead to misinterpretation.
- Limited Scope: While such reports highlight crucial aspects of a business, they do not support comprehensive decision-making. No business decision can be made solely on the grounds of a dashboard report since it is just a glimpse of certain business-related aspects but does not contain comprehensive information.

Frequently Asked Questions (FAQs)
A flash report is generally a page or two long at the most. It briefly describes how the business is performing in real-time at a glance. Since it gives graphical views of relevant metrics, it allows management to make data-backed decisions.
A sales flash report provides a one-page picture of the company's entire sales data, including the gross and net sales, discounts, sales returns, and applicable sales tax for a day, week, or month. It showcases the sales information as the number of transactions made and the total revenue in dollars generated from these transactions.
A flash or dashboard report comprises the daily, weekly, or monthly income and expenses summary presenting the operational profit or loss and other key performance indicators. It highlights revenue, sales numbers, orders fulfilled, trends, demand, etc.
The two types of reports have significant differences in terms of purpose, use, frequency, exhaustiveness, content, audience, and insights or input. While performance reports are comprehensive and prepared at fixed intervals, dashboards offer a quick view of where the business is headed. The target audience differs, too, with performance reports being used by multiple stakeholders at different times, particularly for project management.
