Table Of Contents
Fisher-Price Index Definition
The Fisher-Price Index is a consumer price index used to measure the increase in prices of goods and services over time. It is calculated as the geometric mean of the Laspeyres Index and the Paasche Price Index.
Key Takeaways
- The Fisher-Price Index is a consumer price index utilized to calculate the increase in prices of goods and services over time.
- It is calculated as the Laspeyres index and the Paasche Price Index geometric mean.
- Fisher-Price Index is generally called the real index.
- It corrects for the Laspeyres Price Index's upward bias and the Paasche Price Index's downward bias by taking the average of the two weighted indices using the current and base year quantities as weight.
- Though Fisher-Price Index is the better of the three indices, Laspeyres Price Index is more commonly used to calculate inflations.
Fisher Index Formula
where,
LPI = Laspeyres Price Index = ∑(Pn,t) * (Qn,0) * 100 / (Pn,0) * (Qn,0)
PPI = Paasche Price Index = ∑(Pn,t) * (Qn,t) * 100 / (Pn,0) * (Qn,0) ,
where
- Pn,t is the price of the item at the nth period
- Pn,0 is the price of the item at the base period
- Qn,t is the quantity of the item at the nth period
- Qi,0 is the quantity of the item at the base period
Examples of Fisher-Price Index
Below are the examples of a Fisher-Price Index.
Example #1
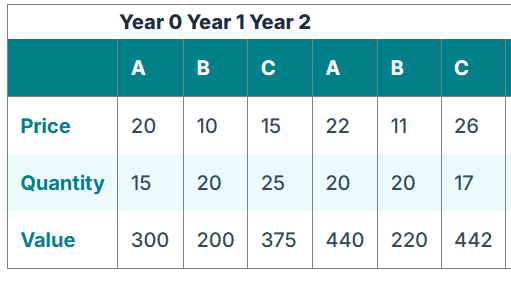
Let us find the Fisher-Price Index for three items whose price and quantity sold are given for three years. For example, for the current year designated as year 0, the prices in dollars and the quantity are provided as follows: -
| Year 0 | Year 1 | Year 2 | |||||||
|---|---|---|---|---|---|---|---|---|---|
| A | B | C | A | B | C | A | B | C | |
| Price | 20 | 10 | 15 | 22 | 11 | 26 | 24 | 12 | 28 |
| Quantity | 15 | 20 | 25 | 20 | 20 | 17 | 25 | 20 | 15 |
| Value | 300 | 200 | 375 | 440 | 220 | 442 | 600 | 240 | 420 |
First, we will calculate the Fisher-Price Index for Year 0 using Laspeyres Price Index and Paasche Price Index.
Laspeyres Price Index for Year 0 -

- For Year 0 the Laspeyres Price Index (LPI) = (20*15+10*20+15*25)*100/ (20*15+10*20+15*25)
- = 100
Paasche Price Index -

- Paasche Price Index = (20*15+10*20+15*25)*100/ (20*15+10*20+15*25)
- = 100
Fisher-Price Index for Year 0 -

- Fisher-Price Index(FPI) = (100*100)^0.5
- = 100
Similarly, we find the indexes for Years 1 and 2 as given.
For Year 1
Laspeyres Price Index
- LPI = (22*15+11*20+26*25)*100/ (20*15+10*20+15*25)
- = 137.14
Paasche Price Index
- PPI = (22*20+11*20+26*17)*100/ (20*15+10*20+15*25)
- = 125.94
Fisher-Price Index (FPI)
- FPI = (137.4*125.94)^0.5
- = 131.42
For Year 2
Laspeyres Price Index
- LPI = (24*15+12*20+8*25)*100/ (20*15+10*20+15*25)
- = 148.57
Paasche Price Index
- PPI = (24*12+12*20+28*15)*100/ (20*15+10*20+15*25)
- = 144
Fisher-Price Index
- FPI = (148.57*144)^0.5
- = 146.27
We have given a tabular representation of the indexes in the following table.

Example #2
Let us consider three commonly used fuels: petrol, diesel, and kerosene. Now, calculate the price indices for three years.
The price in dollars and quantities in liters are shown in the following table: -
| Year 0 | Year 1 | Year 2 | |||||||
|---|---|---|---|---|---|---|---|---|---|
| Petrol | Diesel | Kerosene | Petrol | Diesel | Kerosene | Petrol | Diesel | Kerosene | |
| Price | 60 | 70 | 50 | 65 | 78 | 52 | 50 | 65 | 45 |
| Quantity | 10 | 10 | 15 | 20 | 15 | 18 | 8 | 5 | 10 |
| Value | 600 | 700 | 750 | 1300 | 1170 | 936 | 400 | 325 | 450 |
We can see that the price of fuels increased in Year 1 and decreased in Year 2. Did you notice that the quantities also show a similar trend, which is not surprising as we know that oil and gas exploration companies often reduce production when crude oil (the raw material) price falls?
The table showing the values of the indices, in this case, is given below and can be derived exactly in the same manner as shown in the above example.

Advantages of the FPI
- Fisher-Price Index is often called the real index. It corrects for the upward bias of the Laspeyres Price Index and the downward bias of the Paasche Price Index by taking the geometric average of the two weighted indices. It uses both current year and base year quantities as weight.
- Although it is not a frequently used index due to its structural complexity and the number of variables required, it has widespread use in academic circles and research.
Disadvantages of the FPI
- The only limitation of the Fisher-Price Index is that it is a little more complex construct than the other two.
- The quantities of the future years have to be forecasted, while in the Laspeyres Price Index, only the future prices have to be found.
Conclusion
Although the Fisher-Price Index is the better of the three indices, Laspeyres Price Index is more commonly used for inflation calculations. But if we can accurately forecast future quantities of an item, the Fisher-Price Index gives a more accurate measure.

