Table Of Contents
Financial Modeling Excel Templates
Financial Modeling is the forecast of the company's financial fundamentals based on its past and the expected future. Here you can download 11 Financial Modeling templates for free, including the Alibaba IPO model, Box IPO Model, Colgate Financial Model, Beta calculation, Free Cash Flow to Firm Model, sensitivity analysis model, comparable company analysis model, PE and PE Band Chart, Scenario Model and Football Field Chart.
Table of contents
- Financial Modeling Excel Templates
- #1 - Alibaba IPO Template
- #2 - Colgate Financial Model Excel Template
- #3 - Box IPO template
- #4 - Beta Calculation Worksheet – MakeMyTrip
- #5 - Terminal Value Calculation – Excel Template
- #6 - Free Cash Flow Excel Template
- #7 - PE Chart Template & PE Band Chart Excel Template
- #8 - Football Field Graph
- #9 - Scenario Graph Template
- #10 - Comparable Company Valuation Model Template
- #11 - Sensitivity Analysis
- Recommended Articles
#1 - Alibaba IPO Template
In May 2014, Chinese E-commerce biggie Alibaba filed for its IPO in the US. I created its financial model from scratch. You will learn 3 statement forecasts, interlinkages, DCF Model – FCFF, and Relative Valuation through this template.
#2 - Colgate Financial Model Excel Template
This Colgate Financial model is a part of the Financial Modeling in Excel, where there are two templates – solved and unsolved financial models of Colgate. You can start with Colgate’s unsolved model and follow the tutorial to create a complete Financial model.

#3 - Box IPO template
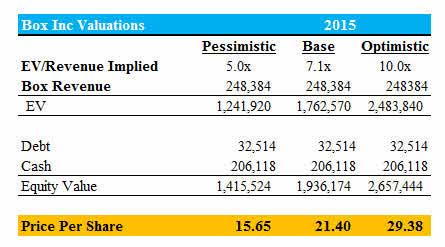
In March 2014, Box filed for registration documents for IPO in the US to raise $250 million. Here I created another template from the start and covered its projection of financial statements of Box, valuations, and target recommendations.
#4 - Beta Calculation Worksheet – MakeMyTrip
Beta measures the sensitivity of stock prices compared to the more extensive INDEX. In this excel CAPM model, we calculate the Beta of MakeMyTrip for NASDAQ.

#5 - Terminal Value Calculation – Excel Template
Terminal Value is the value of the company after the forecast period. It is a fundamental concept as more than 60-80% of the total amount is derived from the Terminal value. This excel template provides two ways to calculate the Terminal value - Perpetuity Growth method and Multiple Method.

#6 - Free Cash Flow Excel Template
In simple terms, the Free Cash Flow firm is Cash flow from Operations and Cash Flow from Financing. FCFF is the foundation of the DCF technique.

#7 - PE Chart Template & PE Band Chart Excel Template
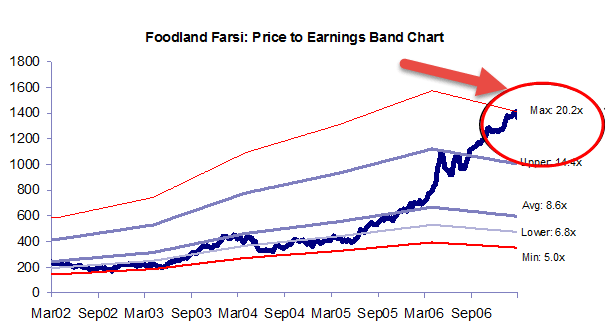
PE Charts and PE Band Charts are very important from an investment banking point of view. They provide a visual glimpse of how valuations have moved over a while. PE Band Charts can be a bit tricky to make. Download this excel model to learn how to make this chart step by step.
#8 - Football Field Graph
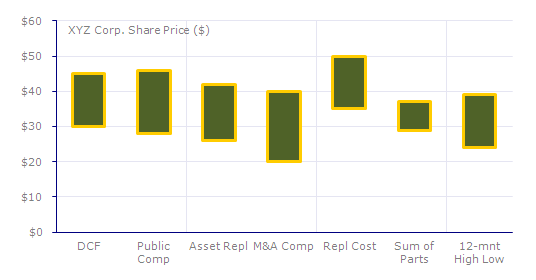
Football Field Chart is very helpful to visually understand the valuation of the firm under various scenarios as well as valuation methodologies. Download this financial modeling template to learn the Football Field Chart.
#9 - Scenario Graph Template
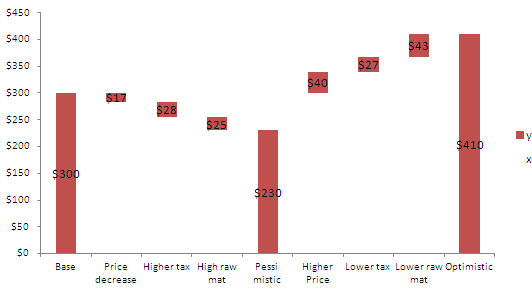
A scene graph is one of my favorites when providing a visual explanation of valuation scenarios. It is a very high-impact graph, and when included in your pitch book or research report, it can make an excellent impression on your clients. Download this Scenario Graph Template.
#10 - Comparable Company Valuation Model Template
Comparable company analysis is nothing but looking at the firm's competitors and taking cues from their valuations. However, there is a way to professionally compare the valuation multiple of competitors, and you can download this financial model template to learn excellent valuation techniques. We use relative valuation multiples like PE Multiple, EV to EBITDA, and Price to Cash Flow.

#11 - Sensitivity Analysis
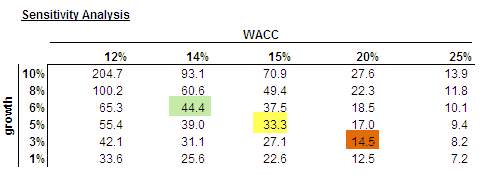
Sensitivity Analysis is fundamental when we have to do Discount Cash Flows and want to check the sensitivity of Fair Price when we change variables like Growth Rates of the Company and Weighted Average Cost of Capital. We use DATA TABLEs in Excel to do this sensitivity analysis.
Recommended Articles
This has been a guide to Financial Modeling Templates. Here we provide you top 11 financial modeling templates, including Alibaba IPO Template, Box IPO template, etc. You can learn more about it from the following articles –

