Table Of Contents
What Is F-Test In Excel?
F-test in Excel is a statistical tool that helps us decide whether the variances of two populations having normal distribution are equal or not. F-test is an essential part of the Analysis of Variance (ANOVA) model.
F-test is performed to test a null hypothesis and gives an independent variable as the result. The sample data used in F-test is not dependent. F-tests can evaluate multiple models simultaneously in a large variety of settings.
Key Takeaways
- The F-Test is used to compare the variances of two data sets and see if they are significantly different.
- You can perform the F-Test using the F-test option through the Data Analysis Toolpak.
- A low F-Test result (closer to 0) suggests that the variances are likely different, while a result closer to 1 suggests they are similar.
- The F-Test is commonly used in hypothesis testing to test assumptions about variability.
How To Enable F-Test In Excel?
The steps to enable F-test in Excel are listed as follows:
Enable the “Analysis ToolPak Add-In” in your worksheet to use the F-test. In Excel, click on “File” at the extreme left and go to “Options” given at the end.

After clicking on “Options,” select “Add-Ins” on the left side. Select “Excel Add-ins” in the Manage box and click “Go.”

In the “Add-Ins” dialog box, click “Analysis Toolpak” and click “Ok.”

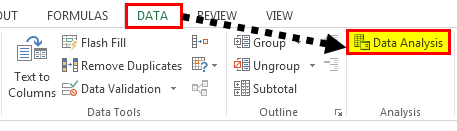
Now, the “Data Analysis” tool will be added to the right side of the Data tab on the Excel ribbon.

How To Do F-Test In Excel?
The steps to perform F-test in Excel are listed as follows:
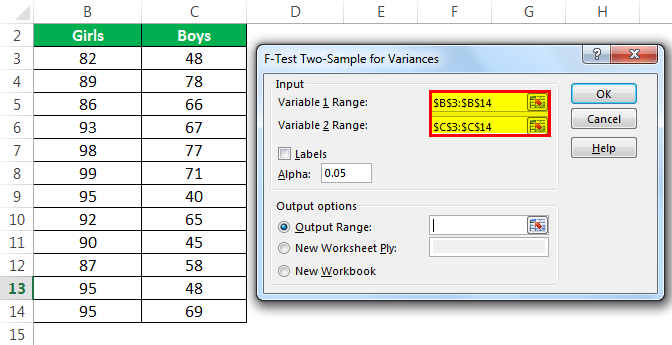
- Step 1: The data used in the F-test analysis is shown in the following image.
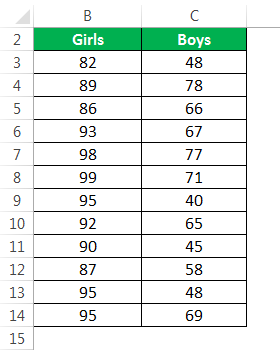
In the Analysis Toolpak workbook, you can practice the analysis of the F-test.
- Step 2: In the Data tab on the Excel ribbon, click on “Data Analysis.”
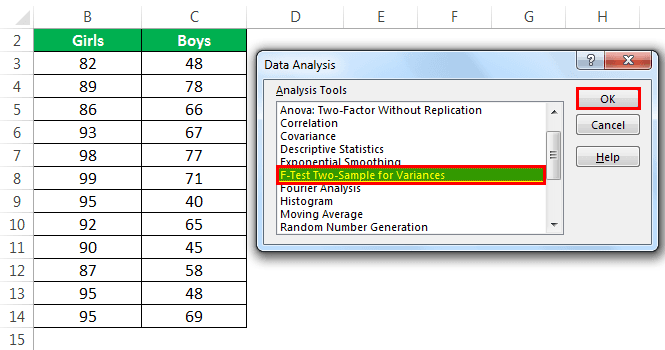
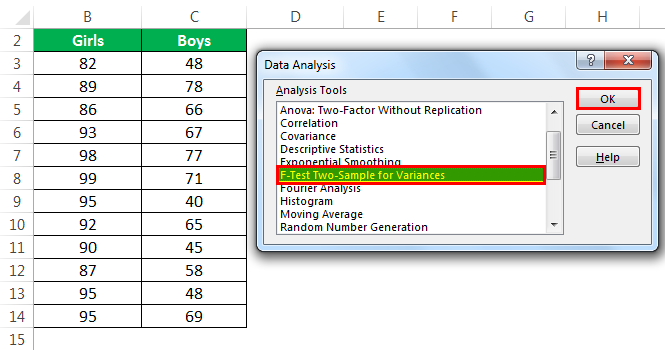
- Step 3: After clicking on “Data Analysis,” a dialog box opens. Click on F-test and click “Ok” to enable the function.
- Step 4: Enter the range of variable 1 and variable 2. To do this, select the range of cells B3:B14 for variable 1 and C3:C14 for variable 2.
- Step 5: Select the “Output Range.”
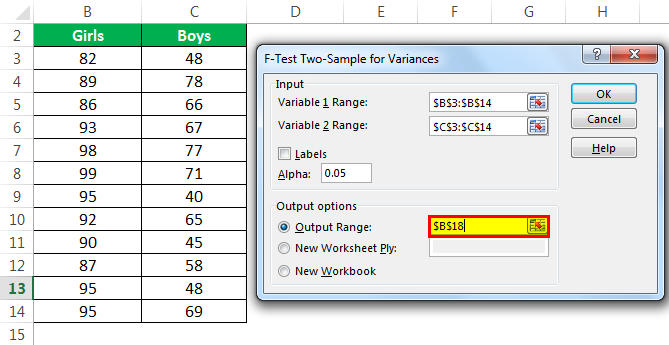
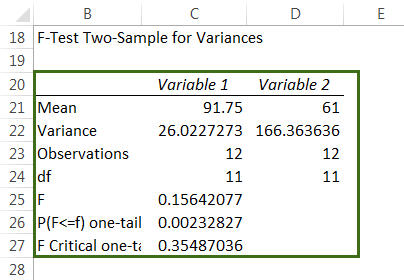
- Step 6: Click “Ok” and the analysis of data appears in the selected cell.
The Working Of F-Test
The following points will help learn more about the F-test function:
- The F-test is used where we need to figure out whether a critical distinction between the variances of two datasets exists or not.
- The null hypothesis is rejected if the variances of the two datasets are unequal and accepted if the variances are equal.
- The F-test calculates the probability or the likelihood of variation.
- The F-test shows an error if:
- The number of values of array 1 or array 2 is less than two.
- The variance of either of the two arrays is equal to zero.
- The F-test cannot be processed on a single sample meaning that two datasets are required.
- The F-test function ignores the text of sample data and gives numbers as the outcome.
The Examples Of F-Test
Some instances where the F-test can be used are listed as follows:
- To analyze the quality of lecture of two professors teaching the same subject.
- To test two samples of bottle gourd in two different experimental conditions.
- To analyze the scores of two groups in the same field.
If you need more detailed information on the F-test, you can check out our F-test article here.
