Table Of Contents
What Is Extreme Value Distribution?
The extreme value distribution (EVD) is a probability distribution widely utilized in statistical analysis to capture rare or extreme events within a data set. Thus, it models the probability of getting the maximum or minimum values when the data set is large.
This distribution is functional when analyzing the tails of a distribution where the likelihood of extreme events is low. However, their occurrence cannot be denied. The EVD is a helpful gauge in various fields, including finance, engineering, environmental science, and insurance, to mitigate the chances of failure if extreme events occur.
Key Takeaways
- An extreme value distribution is a mathematical model describing a data set's maximum or minimum values. It provides insights into how large or small the extreme values will likely be.
- There are three types of EVD - I, II, and III. Type I is the Gumbel distribution; Type II is the Fréchet Distribution; and Type III is the Weibull distribution.
- The EVD is a widely used statistical phenomenon in environmental science, insurance, finance, investment, engineering, etc., for gauging the possibility of extreme events.
Extreme Value Distribution Explained
The extreme value distribution is a probability distribution family used to model a data set's extreme values or tails. The right-skewed distribution resembles the largest extreme value distribution. It is a helpful parameter in finance, environmental science, and engineering, often focusing on analyzing rare or extreme events. It comprises three different probability tests, i.e., Type I, Type II and Type III, which are discussed further.
The extreme value distribution provides reliable outcomes only when the data set exhibits the following characteristics:
- The distributions are continuous, meaning their values are infinite and uncountable, like time;
- They possess an inverse distribution, which refers to the distribution of the reciprocal of a random variable; and
- They are composed of independent and identically distributed random variables, implying no overall trends or fluctuations, and the samples are drawn from the same probability distribution.
The Generalized Extreme Value (GEV) distribution is a three-parameter distribution that encompasses the Type I, Type II, and Type III extreme value distributions. The choice of which model to use depends on the behavior observed in the tail of the parent distribution. However, in many cases, the tail behavior is unknown. The GEV distribution combines all three types into a single general form to address this. However, it is essential to assess the goodness of the fit of the GEV distribution using graphical methods or statistical tests to ensure the appropriateness of the chosen distribution.
Types
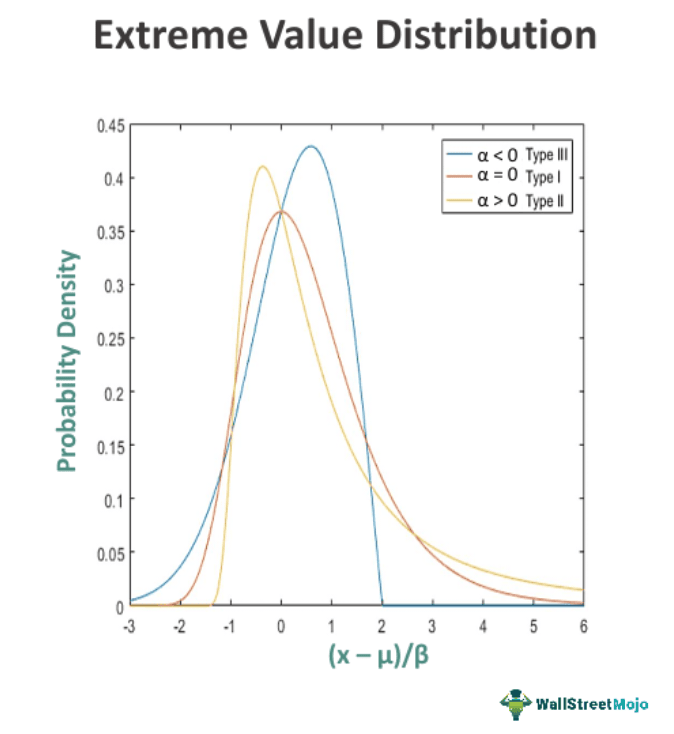
The extreme value distribution is categorized into the following three kinds:
- EVD Type I - Gumbel Distribution: It is used to model the maximum or minimum of a data set as it extends over the entire range of real numbers. It has two forms, one for modeling the minimum values and another for the maximum values. The probability density function of the Gumbel distribution has a fixed shape but can shift based on the location parameter, μ. Increasing μ shifts the distribution to the left, while decreasing μ shifts it to the right. It is a commonly used probability distribution for pollution control.
- EVD Type II - Fréchet Distribution: It is suitable for modeling the minimum of a data set, I.e., bounded on the lower side. It slowly converges to 1 and has three parameters: the shape parameter (α), scale parameter (β), and location parameter (μ). It is a valuable gauge for rainfall estimation, human lifespan, and flood analysis.
- EVD Type III - Weibull Distribution: It is employed to model the maximum of a data set, while a flexible probability distribution can be symmetric or right-skewed (largest extreme value distribution). Type III can be applied for testing the chances of failure at the highest level and ascertaining a product's reliability.
Examples
The selection of a specific extreme value distribution depends on the nature of the data and the type of extreme event under analysis. Some of the EVD examples are as follows:
- A stock market analyst models the lowest possible value to which a stock may fall using the type II EVD.
- An insurance company employs a type II EVD to determine the premium of its life insurance plan by modeling the expected human lifespan.
- A portfolio manager ascertains an investment portfolio's minimum and maximum possible returns using Type I EVD.
Applications
Here are some specific areas where the extreme value distribution finds application:
- Risk Management: The EVD is commonly applied to assess the tail risk associated with extreme events. By modeling the distribution of extreme values, it aids in quantifying the probability of rare occurrences, such as stock market crashes, large-scale natural disasters, or extreme weather events.
- Finance: In finance, extreme value distribution models extreme returns or losses in asset prices. It finds frequent utilization in calculating value-at-risk (VaR) and expected shortfall, which aim to estimate potential losses in investment portfolios due to extreme market movements. These assessments are crucial for risk evaluation and portfolio management.
- Environmental Science: One can apply the extreme value distribution in analyzing extreme environmental events, such as floods, hurricanes, or droughts. By fitting observed data to an EVD, scientists can estimate the return periods or the probability of future extreme events. This information is vital for infrastructure design, flood, floodplain management strategies, and assessing the impacts of climate change.
- Engineering: In engineering, EVD designs structures and systems that withstand extreme conditions. It assists in estimating the maximum load or stresses a structure can hold before failure. By modeling extreme values, engineers can ensure the safety and reliability of various systems, such as bridges, dams, aircraft, or offshore platforms.
- Insurance: It plays a crucial role in actuarial science and insurance. One can utilize it to model and predict rare or catastrophic events that may result in significant insurance claims, such as earthquakes, hurricanes, or major accidents. Insurance companies use EVD-based models to estimate the probability and severity of losses, enabling them to price insurance policies accurately and manage risk effectively.
