Table Of Contents
Exponential Function In Excel
The exponential Excel, also known as the EXP function in Excel, is used to calculate the exponent raised to the power of any provided number. In this function, the exponent is constant and is also known as the base of the natural algorithm. It is an in-built function in Excel.
For example, if we want to determine the constant e to the power of provided numbers, we can use the Excel exponential (EXP) function in such a scenario. If the selected cell is D3, we will use the following formula:
=EXP(D3)
Key Takeaways
- The EXP function returns the value of e raised to a specified power, where e is approximately 2.718.
- It is useful for modeling natural processes that involve continuous change, such as radioactive decay or compound interest.
- EXP can be combined with other functions like LN or LOG to solve exponential equations or perform complex calculations.
Exponential Function In Excel
Excel has an exponential Excel function called the EXP function, categorized as a Math/Trig function that returns a numeric value equal to e raised to the power of a given number.
Exponential Excel Formula

Exp function in Excel takes only one input, which is required; it is the exponent value raised to base e.
What Is e In Mathematics?
The number e is an irrational number whose value is constant and is approximately equal to 2.7182. It is also known as Euler’s Number. The formula calculates the value of the number.


How To Use EXP Function In Excel? (With Examples)
Like the LOG function is used when the rate of change in the data increases or decreases, the EXP function in Excel is used when data values rise or fall at increasingly higher rates.
In Excel, while working on non-linear trend lines (set of points on an exponential Excel function’s graph) or non-linear graphs, the EXP function in Excel is widely used.
An exponential Excel unction is also used to calculate the growth and decay of bacteria and microorganisms.
Exponential In Excel Example #1
Suppose we have a sample for organic solutions. At time t=0 hours, the lab examiner puts one hundred bacteria into the solution to determine the suitable growth medium. After 5 hours, the examiner needs to calculate the count of bacteria. The growth rate of the bacteria in the given organic solution is 0.25/hour.
| Total number of bacteria count at t=0 | 100 |
| Total time for growth of bacteria (in hrs) | 5 |
| Rate of Growth of Bacteria | 0.25 |
| Total number of bacteria after 5 hrs | 129 |
Step 1: For the rate of growth or decay, we have a formula:
A=Pekt
- Where A is the ending amount
- P is the initial amount
- t is the time of growth or decay
- k is the rate of decay or growth
In this case, A= 500, t = 5 hours, k = 0.25, P=?
So, to calculate the value of k in Excel, we have to use the exponential in Excel and the LOG function besides the ROUND function.
P = A/ekt
Therefore, P = A/EXP(k*t)
Step 2: In Excel, the formula will be:
=ROUND(D3+D3/(EXP(G3*F3)),0)
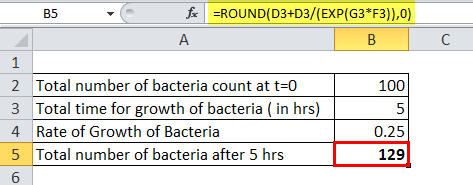
After 5 hours, the total number of bacteria in the given organic solution will be near around 129 in a count.
Exponential In Excel Example #2
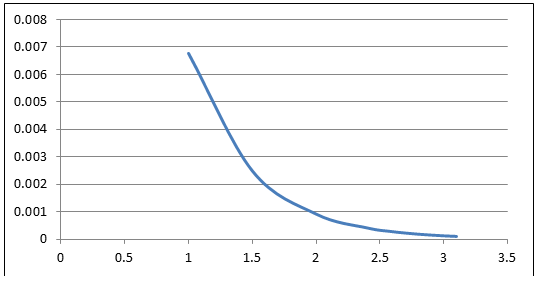
We have a function f(x) that is an exponential function in excel given as y = ae-2xwhere ‘a’ is a constant, and for the given value of x, we need to find the values of y and plot the 2D exponential functions graph.
| x | 1 | 1.5 | 2 | 2.4 | 2.6 | 2.7 | 2.8 | 2.9 | 3 | 3.1 |
| y | ? | ? | ? | ? | ? | ? | ? | ? | ? | ? |
The value of a is 0.05
Step 1: To compute the value of y, we will use the EXP function in Excel so that the exponential formula will be:
=a* EXP(-2*x)
Applying the exponential formula with the relative reference, we have
=$B$5*EXP(-2*B2)
Applying the same exponential formula to other cells, we have:


Step 2: Plotting the graph of the exponential Excel function on the x-y axis, we have the following graph for the above-given function and values
Exponential In Excel Example #3
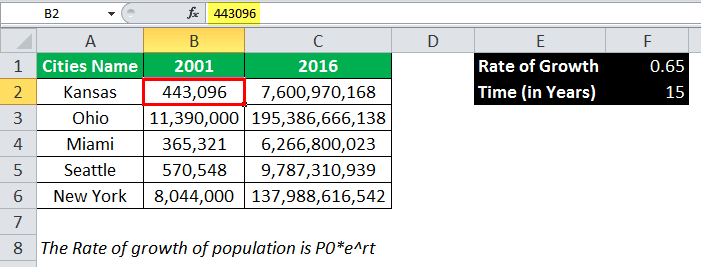
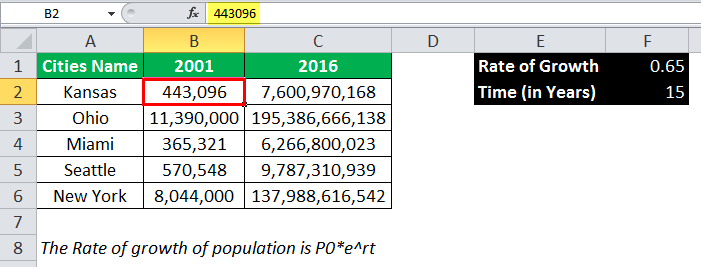
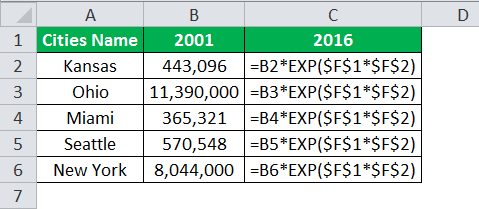
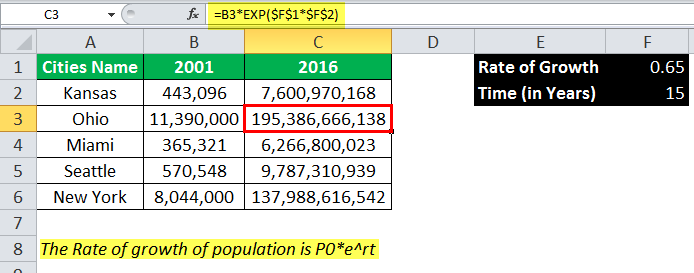
Suppose we have the population data of 5 different cities given for 2001, and the rate of growth of the population in the given cities for 15 years was approximately 0.65%. Then, we need to calculate the latest population of the given cities after 15 years.

Step 1: For the rate of growth, we have the formula:
P = P0*ert
Where P is the latest population (which we will calculate in this case)
- P0 is the initial population
- r is the rate of growth
- t is the time
Here, in this case, we have to calculate P for five different cities with the given rate of growth of 0.65
So, to calculate the rate of growth of the population, we will use the above population growth formula:
Step 2: In Excel, to estimate the exponential power, we will further use the exponential function so that the exponential formula will be:
=B2*EXP($F$1*$F$2)
Applying the same exponential formula to other cities, we have:
Output:
The exponential function in Excel is also used to calculate the probability distribution in the statistics. Hence, it is also known as the exponential probability distribution. The exponential distribution deals with the amount of time for a specific event.
The exponential Excel function has also been used in the regressions linear modeling in the statistics.
Important Things To Remember
- The Exponential function in Excel is often used with the LOG function. So, for example, if we want to find the growth rate or decay, we will use the EXP and the LOG function together.
- We can also use the POWER function in place of the exponential function in Excel. But, the only difference is the measurement precision.

- While using the POWER function, we can provide the of e as 2.71 or maybe up to 3-4 decimal places.
- However, in general, the EXP function in Excel takes the value of e to 9 decimal places.
- The EXP function in Excel always takes the numeric value as an input. Therefore, if we provide any input other than the numeric value, it would generate the #NAME? Error.
