Table Of Contents
What Is Expected Value Formula?
The expected value formula calculates the average long-run value of the available random variables. Then, according to the formula, the probability of all the random values is multiplied by the respective probable random value. Finally, all the results add together to derive the expected value.

The figures obtained using expected value formula help individuals or businesses know the potential of the investment they are considering. An idea about the future return helps them plan their upcoming expenditures properly.
Key Takeaways
- The expected value formula establishes the mean long-run value of the supplied random variables.
- Following that, the likelihood of each random value is multiplied by its corresponding probable random value, as per the formula.
- The predicted value is then calculated by adding each result.
- It is generally used to show an investment’s anticipated future value.
- The expected value formula results may help individuals or businesses understand the investment's potentiality.
- In addition, an idea about the future return helps them plan future expenditures appropriately.
Expected Value Formula Explained
The expected value formula used in the calculator for quick calculations is as below:
where
- pi = Probability of random value
- ai = Probable random value
The calculation of the expected value of a series of random values we can derive by using the following steps:
- Firstly, determine the different probable values. For instance, other probable asset returns can be a good example of random values. Therefore, the probable values are denoted by ai.
- Next, determine the probability of each of the values mentioned above, denoted by pi. Each probability can be any number in the range of 0 to 1 such that the total of the probabilities is equal to one, i.e., 0 ≤ p1, p2,…., pn ≤ 1, and p1 + p2 +….+ pn = 1.
- Finally, we calculate the expected value of all different probable values, as the sum product of each probable value and corresponding probability as below,
Expected value = p1 * a1 + p2 * a2 + ………… + pn * an
Examples
Example #1
Let us take the example of Ben, who has invested in two securities within his investment portfolio. The probable rate of return of both the securities (security P and Q) are as given below. Based on the given information, help Ben to decide which security expects to give him higher returns.
We will use the following data for the calculation of the expected value.

In this case, the expected value is the expected return of each security.
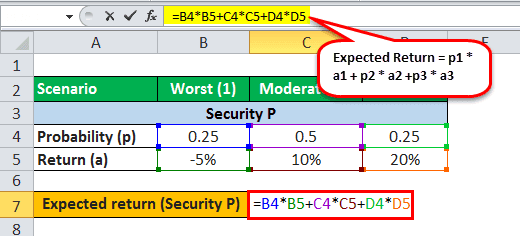
Expected Return of Security P
One can calculate Security P’sexpected return using the expected value formula in Excel:

- Expected return (P) = p1 (P) * a1 (P) + p2 (P) * a2 (P) + p3 (P) * a3 (P)
- = 0.25 * (-5%) + 0.50 * 10% + 0.25 * 20%
Therefore, the calculation of the expected return is as follows,

- Expected return = 8.75%
Expected Return of Security Q
One can calculate the expected return of security Q as,

- Expected return (Q) = p1 (Q) * a1 (Q) + p2 (Q) * a2 (Q) + p3 (Q) * a3 (Q)
- = 0.35 * (-2%) + 0.35 * 12% + 0.30 * 18%
Therefore, the calculation of the expected return is as follows,

- Expected Return= 8.90%
Therefore, for Ben, security Q is expected to give higher returns than security P.
Example #2
Let us take another example where John is to assess the feasibility of two upcoming development projects (Project X and Y) and choose the most favorable one. According to estimates, Project X expects to achieve a value of $3.5 million with a probability of 0.3. In addition, a value of $1.0 million with a probability of 0.7. On the other hand, Project Y expects to achieve a value of $2.5 million, with a probability of 0.4. In addition, achieved a value of $1.5 million, with a probability of 0.6. Determine for John which project expects to have a higher value on completion.
We will use the following data for the calculation of the expected value.

Expected Value of Project X
The calculation of the expected value of Project X can be as follows,

- Expected Value (X) = 0.3 * $3,500,000 + 0.7 * $1,000,000
Calculation of Expected Value of Project X will be –

- Expected Value (X) = $1,750,000
Expected Value of Project Y
The calculation of the expected value of Project Y can be as follows,

- Expected Value (Y)= 0.4 * $2,500,000 + 0.6 * $1,500,000
Calculation of Expected Value of Project Y will be –

- Expected Value = $1,900,000
Therefore, on completion Project Y is expected to have a higher value than Project X.
Relevance and Use
An analyst needs to understand the concept of expected value as most investors use it to anticipate the long-run return of different financial assets. The expected value is commonly used to indicate an investment's anticipated future value. Based on the probabilities of possible scenarios, the analyst can figure out the expected value of the probable values. Although the concept of expected value is often used in various multivariate models and scenario analysis, it is predominantly used in calculating expected return.

