Table Of Contents
What Is EWMA?
The Exponentially Weighted Moving Average (EWMA) refers to an average of data used to track the portfolio's movement by checking the results and output by considering the different factors and giving them the weights. Then, tracking results to evaluate the performance and make improvements.
Weight for an EWMA reduces exponentially for each period that goes further in the past. Also, since EWMA contains the previously calculated average, hence the result of the Exponentially Weighted Moving Average will be cumulative. Because of this, all the data points will contribute to the result, but the contribution factor will go down as calculated in the next EWMA period.
Key Takeaways
- The Exponentially Weighted Moving Average (EWMA) is a data average that one can use to discover the portfolio’s development by determining the outcome and output by considering the diverse factors and enabling them with the weights.
- Moreover, one may know the results to calculate the performance and improve.
- It displays the data geometrically, so data only get affected a little when outliers occur.
- It is an instrument for finding more minor shifts in the time-bound process.
EWMA Explained
EWMA is a tool for detecting smaller shifts in the mean of the time-bound process. An exponentially weighted moving average is also highly studied and used as a model to find a moving average of data. It is also very useful in forecasting event based on past data.
The Exponentially Weighted Moving Average is an assumed basis that observations are normally distributed. It considers past data based on their weightage. As the data is more from the past, its weight for the calculation will decrease exponentially.
Users can also give weight to the past data to find a different set of EWMA basis different weightage. Also, because of the geometrically displayed data, data doesn’t get affected much because of the outliers. Hence, more smoothed data can be achieved using this method.
Formula
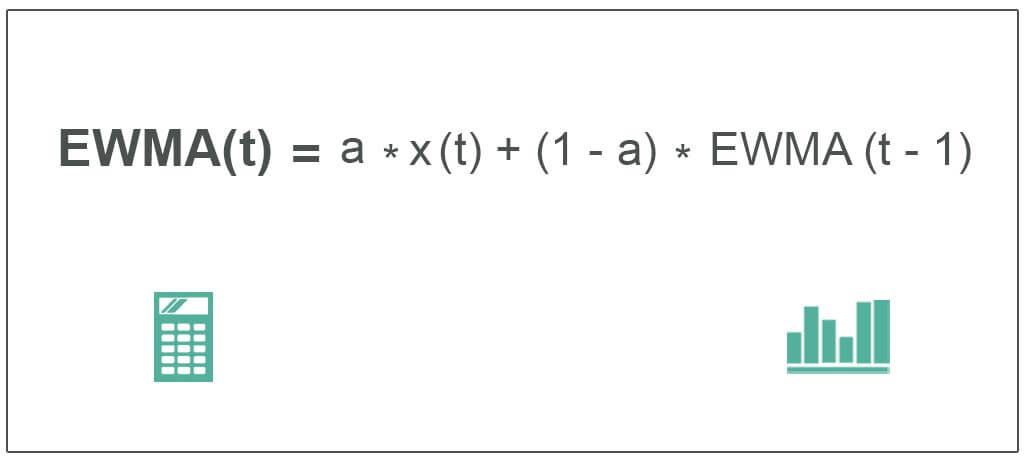
This EWMA formula shows the value of the moving average at a time t. Its application would help us understand the EWMA volatility and its implications.
EWMA(t) = a * x(t) + (1-a) * EWMA(t-1)
Where,
- EWMA(t) = moving average at time t
- a = degree of mixing parameter value between 0 and 1
- x(t) = value of signal x at time t
This formula states the value of moving average at time t. Here, a parameter shows the rate at which it will calculate the older data. The value of a will be between 0 to 1.
Suppose a=1 means only the most recent data used to measure EWMA. If a is nearing 0, that means more weightage is to older data. If a is near 1, newer data has given more weightage.
Examples
Below are the examples of Exponentially Weighted Moving Average or EWMA filter. These examples shall help us understand the concept in depth.
Example #1
Let’s consider 5 data points as per the below table:
| Time (t) | Observation (x) |
|---|---|
| 1 | 40 |
| 2 | 45 |
| 3 | 43 |
| 4 | 31 |
| 5 | 20 |
And parameter a = 30% or 0.3
So EWMA(1) = 40
EWMA for time 2 is as follows:
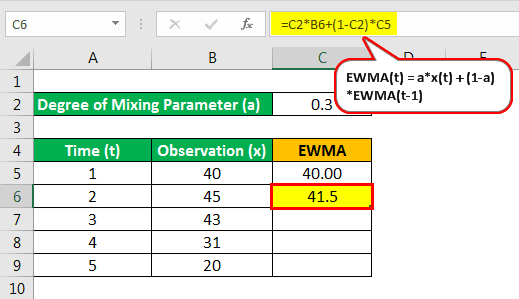
- EWMA(2) = 0.3*45 + (1-0.3)*40.00
- = 41.5
Similarly, calculate the exponentially weighted moving average for given times:
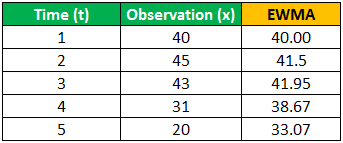
- EWMA(3) = 0.3*43 + (1-0.3)*41.5 = 41.95
- EWMA(4) = 0.3*31 + (1-0.3)*41.95 = 38.67
- EWMA(5) = 0.3*20 + (1-0.3)*38.67 = 33.07
Example #2
We are having the temperature of a city in degrees Celsius from Sunday to Saturday. Using =10%, we will find the moving average temperature for each day of the week.Using a =10%, we will find an exponentially weighted moving average for each day in the below table:
| Weekday (t) | Temperature oc (x) |
|---|---|
| Sunday | 24 |
| Monday | 30 |
| Tuesday | 36 |
| Wednesday | 25 |
| Thursday | 22 |
| Friday | 29 |
| Saturday | 30 |
Using a =10%, we will find an exponentially weighted moving average for each day in the below table:
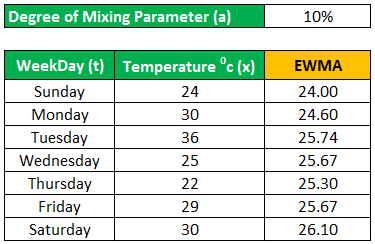
Below is the graph showing a comparison between the actual temperature and EWMA:
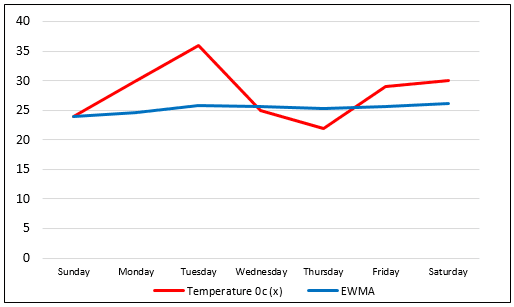
As we can see, smoothing is quite strong, using =10%. In the same way, we can solve the exponentially weighted moving average for many kinds of time series or sequential datasets.
Importance
Below are a few points to consider when discussing EWMA:
- We want to get an exponentially weighted moving average for data that we want to be time ordered.
- It is beneficial in reducing noise in noisy time series data points, which can be called smooth.
- Each output is given a weightage. The more recent data is, the highest weightage it will get.
- It is quite good at detecting smaller shifts but slower at detecting large ones.
- One can use it when the subgroup sample size is greater than 1.
- One can use this method in chemical and day-to-day accounting processes in the real world.
- One can also use it to show website visitors' fluctuations on days of the week.
Advantages & Disadvantages
The EWMA volatility has its own set of advantages and disadvantages. Let us understand them through the discussion below.
Advantages
- One can find average using an entire history of data or output. All other charts tend to treat each data individually.
- Users can give weightage to each data point at their convenience. One can change this weightage to compare various averages.
- EWMA displays the data geometrically. Because of that, data doesn’t get affected much when outliers occur.
- Each data point in the Exponentially Weighted Moving Average represents a moving average of points.
Disadvantages
- One can only use it when continuous data is available.
- One can use it only when we want to detect a small shift in the process.
- One can use this method to calculate the average. Monitoring variance requires the user to use some other technique.

