Table Of Contents
What Is An Envelope Channel?
An envelope channel refers to an indicator used in technical analysis that one can plot over a financial instrument’s price chart with lower and upper bounds. This popular technical analysis tool can help traders spot the potential oversold and overbought levels, providing signals for potential trend reversals.

Traders can use this trend-following indicator to define securities’ trading ranges. One must note that such an envelope will lag behind security prices just like moving averages do. There are different types of envelope channels. Two of them are EMA (exponential moving average) envelopes and SMA (simple moving average) envelopes.
Table of contents
- What Is An Envelope Channel?
- Envelope channels refer to lower and upper bands around securities’ price bars, which are created by an MA (moving average) and a preestablished distance over and under the MA.
- A noteworthy limitation of envelope channels is that traders might not be able to use them effectively if a market is highly volatile.
- Four types of envelopes in technical analysis are simple moving average, exponential moving average, weighted moving average, variable moving average, and weighted moving average.
- A key benefit of this technical indicator is that it helps traders identify oversold or overbought positions and place sell or buy orders accordingly.
How Does An Envelope Channel Indicator Work?
An envelope channel is a tool that enables one to spot a trading range’s lower and upper bands by plotting a couple of MA envelopes on a financial security price chart. One envelope is moved up to a specific distance over the price while the other one is shifted below. Traders can identify an asset’s oversold and overbought levels using this tool.
Individuals can compute the distance over and under the MA via a percentage variable that is lower and higher than the MA or the total number of standard deviations. One must note that envelope channels based on standard deviation change with time because of a financial instrument’s volatility by narrowing or widening the bands, unlike conventional price channels.
Typically, the lower and upper bounds are such that an asset’s price tends to remain within the lower and upper thresholds in normal conditions. For volatile securities, traders may utilize higher percentages while establishing the envelope to steer clear of whipsaw trading signals. Simultaneously, less volatile financial instruments may require higher percentages for generating sufficient trading signals.
Types
The different types of envelope channels are as follows:
- Simple Moving Average Envelope: This is the simplest form, using SMA as the central line. The lower and upper bands get set at a particular percentage away from it.
- Exponential Moving Average Envelope: The exponential moving average envelope is like the simple moving average one. However, the former utilizes EMA, giving the recent prices additional weight.
- Variable Moving Average Envelope: It adjusts the MA to the volatility of the market, altering the width of the envelope on the basis of the market volatility. This can be useful for traders when significant price swings occur in the market.
- Weighted Moving Average Envelope: The weighted moving average envelope gives more importance to recent information, similar to the exponential moving average envelope. That said, the main difference is the computation of the averages.
How To Calculate?
The envelope indicator formula is as follows:
Upper Band Or Upper Envelope = (SMA Over A duration) + (SMA Over A Duration x D^%)
Lower Band Or Lower Envelope = (SMA Over A Duration) – (SMA Over A Duration x D%)
One must note that ‘D’ refers to the deviation value that shows the distance between moving averages and envelopes.
How To Trade?
When traders use this strategy in technical analysis, the generation of a buy signal takes place if a security’s price gets to the lower band. This suggests that the financial instrument is oversold, which, in turn, indicates that the price may increase soon, giving traders potentially a great opportunity to place a buy order.
Conversely, when an asset’s price gets to the upper band, it suggests that the asset is overbought. This indicates that the price can decrease soon, giving traders a potentially decent opportunity to sell the security.
That said, as will all trading strategies, managing risk is crucial. Traders must consider utilizing stop losses to safeguard substantial losses if the asset’s price does not move per expectations.
Chart
Individuals can observe the Bitcoin/Tether chart provided below to understand envelope channels.
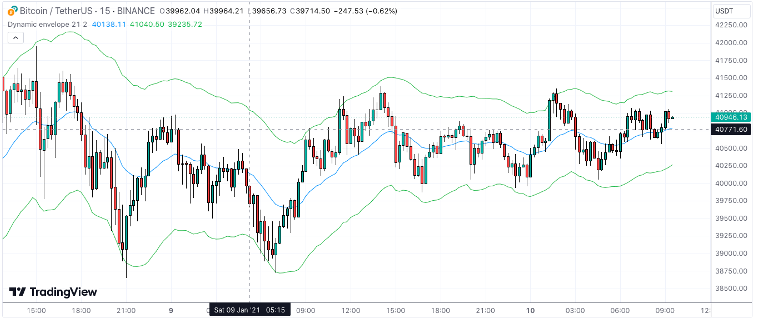
The blue line in the above chart represents the moving average, and the lower and upper price bands above and below the moving average denote the envelope channel. As one can observe, there’s a specific distance between the bands and the moving average. As the price reaches the upper band, it indicates overbought conditions, which means it gives a sell signal. In contrast, when the price reaches the lower band, it indicates oversold conditions. This means it generates a buy signal.
Thus, if a person entered a long position when the price level touched the lower price band on January 8, 2021, they could have made significant gains from the following uptrend. If individuals need to develop their understanding of how this tool can provide both buy and sell signals to technical analysts, they can look at the various other charts with envelope channels already published on TradingView.
Examples
Let us look at a few envelope channel examples to understand the concept better.
Example #1
Suppose Sam, a trader, spots the opportunity to use the envelope channel strategy to trade ABC stock and make financial gains. He used a 10-day simple moving average and deviation showing the distance between the envelopes and the MA was 1%. The upper envelope and the lower envelope moved parallel to the 10-day SMA. The price of the stock was consistently moving near the upper boundary. This indicated an overbought position, meaning that the price could decrease soon. So, Sam sold the stock to realize his gains.
Example #2
Suppose a trader named David used an envelope channel strategy to trade ABC stock. He considered a 10-day SMA while the deviation between the envelopes and MAs was 2%.
The computations for the envelope were as follows:
Lower Bound = SMA10 + SMA10 x 0.02
Upper Bound = SMA10 - SMA10 x 0.02
Midpoint = SMA10
When the security’s price moved below the lower bound, David sold ABC shares in his portfolio, viewing it as a sell signal. His decision turned out to be correct as the stock price decreased significantly.
Importance
One can observe the following points to understand the importance of this technical indicator for traders:
- It can help market participants in spotting overall market trends. When security prices are consistently close to or touching the upper boundary, traders can view it as a strong indication of a strong uptrend. That said, if security prices are often at or close to the lower envelope, it is a strong sign of a downtrend.
- Changes in an envelope’s width can suggest changes in the security’s volatility. Typically, wider envelopes signify higher price volatility. On the other hand, narrower envelopes indicate lower volatility.
- It can help spot oversold or overbought positions.
Limitations
The limitations of envelope channels are as follows:
- The security prices might break through the upper or lower boundaries owing to ‘noise’ or temporary market fluctuations. This may result in false sell or buy signals, potentially leading to unprofitable trades.
- If traders do not select the right percentage and the appropriate MA type and length, the indicator may give significantly different results, and the trader could miss good trading opportunities.
- The trading tool might not be effective in a highly volatile market. Significant price swings might occur in such scenarios, potentially leading to poorly timed trades.
For professional-grade stock and crypto charts, we recommend TradingView – one of the most trusted platforms among traders.
Disclosure: This article contains affiliate links. If you sign up through these links, we may earn a small commission at no extra cost to you.

Frequently Asked Questions (FAQs)
Commonly, traders use this trading tool in combination with other types of tools to increase their chances of success. For instance, traders can spot potential opportunities when an asset’s price shifts outside the envelope. Then, they can observe volume metrics or chart patterns to find out when a tipping point might occur. After all, financial instruments may trade at oversold or overbought conditions for a long duration.
The envelop indicator involves utilizing a fixed deviation percentage. On the other hand, Bollinger bands compute the deviation utilizing the standard deviation of financial instruments’ prices.
Moving average envelopes refer to percentage-based envelopes that are set below and above a moving average. That said, the moving average concept forms the base for the envelop channels. It captures the average alteration in a data series over a certain duration.
Recommended Articles
This article has been a guide to what is an Envelope Channel. Here, we explain its types, how to calculate and trade it, examples, importance, & limitations. You may also find some useful articles here -
