Table Of Contents
Dragonfly Doji Candlestick Meaning
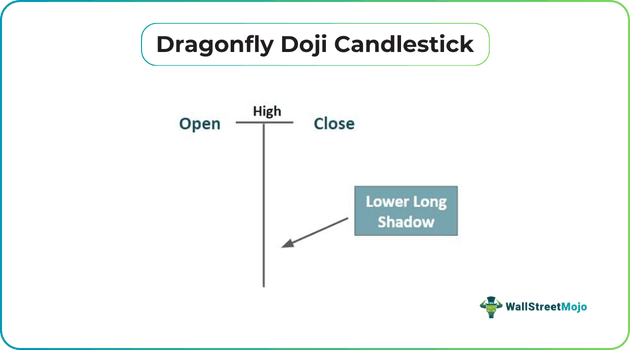
Dragonfly Doji Candlestick is a Japanese candlestick pattern that defines a potential reversal in the trend. In simple terms, it indicates a possible price change in the market for an asset with open, closed, and high prices at the same level. This candlestick pattern acts as a clue for traders, helping them identify both an uptrend and a downtrend.
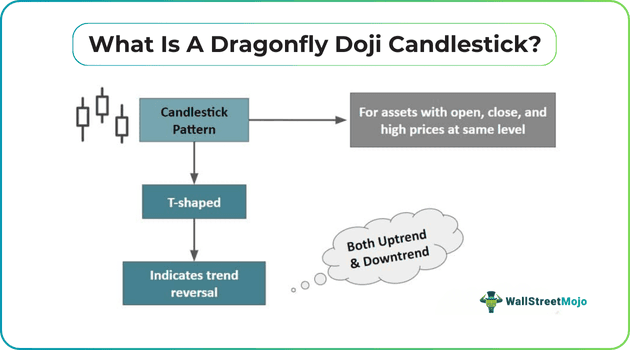
The candlestick appears in the shape of a T, which is the opposite of another Japanese candlestick named Gravestone Doji, forming an inverted T. Traders wait for confirmation before making a trading decision on whether to make a trade or not. The emergence of such candlestick patterns is not a usual phenomenon and is visible in rare scenarios.
Key Takeaways
- Dragonfly Doji Candlestick is an indicator of a potential trend reversal for any asset with its open, close, and high prices.
- It appears for upward and downward trends and works reasonably well in the stock and FOREX currency markets.
- The opposite of Dragonfly Doji is the Gravestone Doji candlestick, which appears when the price opens and closes at the lower end of a trading range.
- Without the confirmation candlestick pattern appearing next to Dragonfly Doji, no trader decides to move into the market.
Dragonfly Doji Candlestick Explained
A Dragonfly Doji candlestick is used to replicate a scenario where an asset’s opening price, high price, and closing price in a trading session or active market are the same, and it is the same reason that it does not have any real body. It is a rare occurrence and is linked to market indecisions. Again, the candlestick pattern is neutral in context to direction, and it is up to the analyst or trader to interpret it carefully. Apart from indecision, it is known for representing price reversal. Dragonfly Doji candlestick in an uptrend is a downward price reversal warning or indication. It comes with a long downward wick or a lower long shadow, and signals that the bearish trend is strengthening.
Similarly, in the bearish Dragonfly Doji candlestick pattern, the price will move either upward or downward. It also indicates that the asset is experiencing aggressive selling parallel to a buying force that keeps the opening and closing prices the same. One of the most important factors is the formation of the next candlestick after the Dragonfly Doji. This next candlestick is treated as a confirmation. This means that once the Dragonfly Doji appears on the charts, traders wait for its next candlestick pattern to ensure the scenario. Traders enter the market only after the second confirming candlestick appears.
It is often suggested that, whether it is a bullish Dragonfly Doji candlestick or bearish, applying stop loss would help traders reduce the risk. When taking a long position in a bullish trend, it must be applied to the lowest of Dragonfly’s wick, and likewise, the stop loss must be applied at the high end of Dragonfly Doji in a bearish trend.
This candlestick pattern rarely appears, which is one of the key limitations of the Dragonfly Doji, given an active market where price reversal is dynamic and constantly fluctuating. This is what makes some traders believe that this pattern is unreliable and overestimated.
Examples
Let us look at the following scenarios to understand the concept better:
Example #1
In April 2023, the GBP/JPY made a negligible advance in the Asian session. The currency pair witnessed an inverted hammer followed by a Dragonfly Doji candlestick in an uptrend. Before this, the pair’s price action formed candlestick patterns showcasing a fading upside movement.
The formation depicted the lack of decisiveness in the GBP/JPY traders. Others indicated oscillators, like the Relative Strength Index (RSI), turned flat with fading buying pressure. All traders are looking forward to the exponential moving average. The currency pair should crack the 164.50 target for a bullish trend to return.
Example #2
Another excellent example of Dragonfly Doji appeared in the crypto market for Bitcoin on June 20th, 2022, when its opening and closing prices were both $20,574. This candlestick pattern created a bullish pattern for the next trading day. A day earlier, Bitcoin was trading in green but has witnessed a bear run since the beginning of the year.
A week earlier, the cryptocurrency came below 20K, and traders were looking for a recovery sign. When the Bitcoin value revived, traders took a sigh of relief. The new traders, likewise, also anticipated a price reverse. When the Dragonfly Doji pattern appeared, its trading volume was $35.58 billion, and therefore, the signals were taken as much more reliable for crypto traders to be hopeful.
Dragonfly Doji Candlestick vs Hammer Candlestick
Dragonfly Doji candlestick pattern and hammer candlestick pattern are two patterns commonly formed. Let us have a look at the differences between the two:
- Dragonfly Doji indicates a possible price reversal, either downside or upside. On the contrary, a hammer candlestick appears when the prices are trading far below the bottom of their opening level.
- Dragonfly Doji candlestick opens and closes at the same level. In contrast, the hammer candlestick opens lower and closes below the opening price level.
- It is considered more accurate than the hammer candlestick.
- The bullish Dragonfly Doji candlestick is much more reliable with the next confirming candlestick, but with the hammer candlestick, there is no guarantee that the reversal will occur.
For professional-grade stock and crypto charts, we recommend TradingView – one of the most trusted platforms among traders.
Disclosure: This article contains affiliate links. If you sign up through these links, we may earn a small commission at no extra cost to you.