Table Of Contents
Double Top Pattern Meaning
A double top is a chart pattern characterized by two price highs that are rejected by a resistance level, signaling a potential bearish reversal trend. Traders typically look for the price to close below the confirmation line, accompanied by an increase in volume, before initiating a sell signal.

This pattern often occurs towards the end of a bullish market, challenging the notion of random price behavior. Double-top patterns provide a bearish signal widely utilized in forex and equity markets. However, it's important to note that not all double tops form equally, with some suggesting the market will continue higher while others indicate a downward move.
Table of contents
- Double Top Pattern Meaning
- The double-top pattern is an indicator that suggests a potential trend reversal, either in the short or long term.
- Traders can utilize the double-top pattern to identify possible reversals and make informed buying or selling decisions.
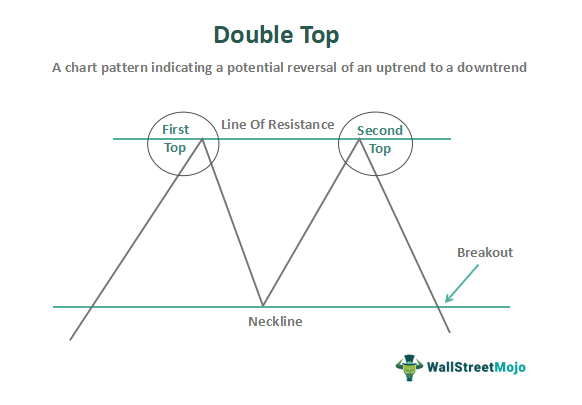
- The pattern consists of the first top, trough, second top, and a neckline break, signaling a market trend reversal.
- Notable distinctions among the three patterns are that the double top relies on volume for trend reversal indication. The double bottom indicates the end of a downtrend. And the head and shoulders pattern is considered the most reliable for confirming trend reversals.
Double Top Pattern Explained
The double-top pattern is the most common bearish pattern with the characteristic of two consecutive peaks with a trough having almost the same price level. It informs the traders, investors, or analysts that the market has many buyers indicating that demand has overtaken the supply, causing the price to rise during the first top formation.
After the formation of the first top, the trend starts going down, indicating that sellers have increased, signaling that supply has overtaken demand in the market. Then the supply starts overtaking demand leading to a fall in prices. As a result, a neckline gets created in the shape of a valley. Market domination by bulls or buyers follows the valley, again causing price rises. After that, when traders find that the prices have not risen beyond the first top, the bears or sellers dominate the market, causing the price to fall. As a result, one sees the formation of a double top. Moreover, if the prices ever fall outside the valley, traders take it as a bearish signal.
Furthermore, traders know the presence of a double top using the data obtained from the volume factor and time duration between the two peaks. It must get noted that any price built up to reach the first peak occurs due to the increased volume. As soon as the volume falls too low, the neckline falls. Moreover, the second top also gets formed due to the high volumes.
The only way to confirm the double top pattern has been to look at the duration of formation of the two peaks; If the two peaks formed within a short time, then the trend may resume forming a part of consolidation.
Examples
Let us take the help of some examples of double-top to understand the concept.
Example #1
Let's say the price of a stock has been in an uptrend, reaching a resistance level at $50. It attempts to break above this level twice but fails both times, forming two peaks at $50. After the second failed attempt, the price started to decline, indicating a potential bearish reversal. Traders who recognize this double-top pattern may consider selling or taking bearish positions.
Example 2
In another scenario, let's consider the price of a cryptocurrency that has been steadily rising. It reaches a resistance level at $10,000 and fails to break above it on two separate occasions, forming two peaks at $10,000. After the second failed attempt, the price started to decline, suggesting a potential bearish reversal. Traders who spot this double-top pattern might interpret it as a signal to sell or take bearish positions.
Chart
Let us understand more about the double top using the chart given below:

The graph typically displays the price movement over a specific timeframe, with the price plotted on the vertical axis and the time intervals plotted on the horizontal axis. The two peaks are visible as higher points on the graph, often forming an "M" shape. The resistance line is drawn across the top of the peaks, connecting them.
A support line is also drawn across the trough or valley that forms between the two peaks. This support line represents a level where the price finds temporary buying interest and prevents further decline.
In the chart of Nifty 50 given below, taken from TradingView, the concept is clearly visible. The first and second peaks are marked by circles, which makes the pattern appear like the shape of the letter M. The first peak shows a down move for a few trading sessions, due to which there is a fall, as shown in the chart. Then again, the price shows an uptrend and reaches the second peak. Then, as per the tendency of this kind of pattern formation, the prices move down. Once it reaches below the neckline, it is an explicit confirmation that the market is on a downtrend now. Therefore, the trader needs to wait and watch till the price levels reach the neckline and get a breakout downwards; else, if, due to some special conditions, the stock shows do not obey the typical rule of double top, then the trader will suffer losses. Typically, the trader can measure the distance between the top and neckline to estimate how much the downfall is likely to be, as shown in the chart by red arrows.

Double Top vs Double Bottom vs Head And Shoulders
Here are the main differences between the three:
| Double Top | Double Bottom | Head and Shoulders |
|---|---|---|
| M shape | W shape | It tends to represent a technical indicator formed of three peaks with the two outside peaks of the same height and the middle one as the highest. |
| It indicates a trend that gets bearish reversal. | Double bottom signals a trend that gets bullish price movement. | Head and shoulders indicate a bullish-to-bearish or bearish-to-bullish reversal of the trend. |
| It does not act as a conformed trend reversal without volume support. | The double bottom may or may not tend to be a confirmed trend reversal. | It gets deemed the most reliable form of trend reversal of chart formation. |
| It helps to know the signals of a trend reversal. | Forms a bullish trend reversal. | It aids traders in visualizing the previous price trends of the market. |
| It also does help in buying or selling bur using the help of volume. | Points to the ending of a downtrend and starting of an uptrend. | It helps traders to make an informed decision about buying or selling. |
| It has two peaks above the neckline. | The pattern has two lows below the neckline. | The pattern has three peaks, either above or below the neckline. |
| A trader must put a stop loss at the end of the second peak. | A trader must put a stop loss at the end of the second low. | The stop loss must be put at the right shoulder's lowest point. |
| The price target must be equal to the length equivalent to the distance between the two tops and the neckline. | The price target must be equal to the length equivalent to the distance between the two lows and the neckline. | It gets set as the difference in price between the head and the distance between either of the shoulders. |
For professional-grade stock and crypto charts, we recommend TradingView – one of the most trusted platforms among traders.
Disclosure: This article contains affiliate links. If you sign up through these links, we may earn a small commission at no extra cost to you.
Frequently Asked Questions (FAQs)
The best time frame for identifying double tops depends on the trader's preference and style. Shorter time frames, like intraday charts, may reveal more frequent double tops, but they can be less reliable. Longer time frames, such as daily or weekly charts, provide more significant and reliable double-top patterns.
A double-top breakout occurs when the price of an asset breaks below the neckline of a double-top pattern, confirming the bearish reversal. It signifies that the selling pressure has intensified, and the price will likely continue falling.
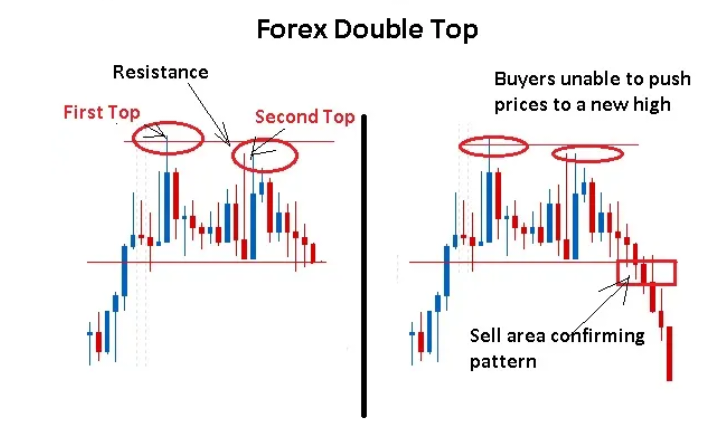
When trading double tops and double bottoms in Forex, traders typically wait for the pattern to be confirmed before taking action. They observe the price breaking below the neckline for a double top or above it for a double bottom, along with increased volume as a confirming factor. Entry points are often placed near the neckline, while stop-loss orders are positioned above the pattern's high for double tops and below the pattern's low for double bottoms. Price targets can be determined by measuring the pattern's height and projecting it in the direction of the reversal.
Recommended Articles
This article has been a guide to Double Top and its meaning. We compare it with double bottom and head & shoulders, and explain its examples with a chart. You may also find some useful articles here -

