Table of Contents
What Is Diamond Top Pattern?
Diamond top pattern is a form of candlestick arrangement formed in technical charts and widely used in the financial market. Here, as the name suggests, the peaks and troughs formed by connecting them using trendlines signify a diamond.
This pattern is typically found at the end of a trend and leads to a reversal of prices in the future. At the end of the formation, usually, there is a breakout in the form of a bullish or bearish candle to denote the new price trend, which is accompanied by a decrease in trading volume.
Key Takeaways
- Diamond top pattern is a technical indicator that is a rare formation but widely used by traders in the financial market.
- In this pattern, the peaks and the troughs formed using candlesticks are connected to form a diamond-like arrangement.
- It is known as a trend reversal pattern and suggests a change from an uptrend to a downtrend and vice versa.
- During its formation, the volume of trade remains low, and traders wait for a breakout to happen to decide the investment strategy.
Diamond Top Pattern Explained
Diamond top pattern is a candlestick pattern used in the technical analysis of charts for making investment decisions in various financial instruments. In this pattern, the candlesticks take the shape of a diamond by connecting the highs and lows of the price movements within the chart.
This is commonly used as a trend reversal indicator, which gives the signal of change from uptrend to downtrend and vice versa. However, it requires skill and experience to locate it correctly in the chart because it does not appear too often. But its appearance provides a profitable trading opportunity.
The diamond top chart pattern can be bullish or bearish, depending on the direction of the change in the trend. But it takes time to form completely, which may be a few weeks to months. Therefore, it is not very suitable for day trading or very short-term trading. It provides good clarity for long-term traders.
The trend lines are drawn connecting the peaks and the troughs of the candlestick patterns, which initially diverge up and down, creating a wide angle. Then, both the trend lines break at one point, reversing their direction and converging at a point. In this way, the diamond shape is formed, which is not easy to detect. Thus, the candles within the diamond formation are more or less considered a consolidation phase, followed by a trend reversal.
Characteristics
It is essential to understand the characteristics of this diamond top chart pattern, as given below:
- The candlesticks typically form higher highs along with lower lows in this pattern initially, and then they are followed by lower highs along with higher lows.
- It is possible to connect each of the peaks and troughs using trend lines.
- There will be a change in direction from the initial stage, which is before the beginning of the diamond shape, to the final stage, where the diamond shape comes to an end.
- A consolidation of the market marks the period within the diamond pattern.
- The formation indicates that both the bulls and the bears are in equal control of the market, bringing an equilibrium in prices.
- The endpoint of the diamond is marked by a breakout, either upside or downside. Usually, the change takes place in the opposite direction of the prevailing trend. Therefore, the change may be either bearish or bullish.
Formation
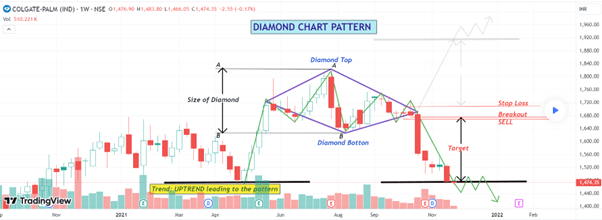
As mentioned above, this pattern may be bullish and also bearish. It is better to understand it with the help of a TradingView chart, as given below. The chart shows a bearish pattern formed in the shape of a diamond. The shape has been explained very well by connecting the highs and lows with trend lines in order to complete the formation.
From the chart itself, it is visible that the formation took almost six months to complete, suggesting that diamond top pattern trading is a long-term pattern. Here, the initial price movement was an uptrend, but after the diamond formation, the price movement reversed, and the final direction was downwards.
A red bearish candle is seen as a breakout from the consolidation, which traders can take as the entry point for a short position or sell off their holding and take the profits, in case they had taken a long position previously.
The price target for the trade is marked by the lowest level of the previous uptrend before the diamond formation. It is necessary to use stop loss for risk management, which in this case is taken as the uppermost point of the previous candle before the breakout.
How To Trade?
This section will explain diamond top pattern trading.
- Traders need to wait for a breakout to happen before they decide to take a trade. This can happen upside, crossing the upper trendline, or downside, crossing the lower trendline, suggesting a price reversal. But the confirmation is more decisive if case the volume is very high. If volume is low, traders should be careful because this may be a false breakout. Therefore, prices will come back to their previous trend.
- The time frame selected for studying and locating the pattern should be extended because it takes time to form.
- Once the breakout has happened, the trader should look for the proper target price, which should be the profit level they expect to earn from the trade. This will be the gap between the widest part of the diamond pattern and add to the breakout level, which will be either at the support or at the resistance.
- It can also be considered a continuation pattern instead of a reversal. But in that case, the breakout from the upper trendline will signify a long position, and the breakout from the lower trendline or support line will signal a short position.
- The stop loss should be at the uppermost point of the breakout in case it is from the resistance, and it should be at the lowermost point of the breakout in case it is from the supports.
Examples
The concept is easy to understand diamond top stock pattern using some suitable examples, as given below:
Example #1
John is a long-term investor who has spotted a diamond pattern in a weekly chart of ABC Industries that lasted for almost three weeks. The previous trend was an uptrend, and therefore, John is anticipating the new breakout to be on the downside. This is supported by the fact that ABC Industries has come up with weak financials for the last three quarters and has accumulated a lot of debt in the market lately. Therefore, his final aim is to sell off his holders at the bearish breakout.
Example #2
In the stock of CG Power, signals below, the chart reveals the candlestick has formed a bullish diamond top pattern. It shows a breakout with a small green candle, aiming for an uptrend in the future. It is to be noted that the trend prior to the diamond formation is another consolidation, where the market has moved in the same direction, but the diamond pattern started with a big bullish move. Here, the trader can get better confirmation by using a combination of other indicators, like the MACD and the RSI, which support the bullish move.
Benefits
Here are some benefits of the formation of a diamond top stock pattern.
- It is a very suitable pattern for long-term investing since the formation takes a few weeks to months, as shown in the chart.
- It can be comfortably used as a trend reversal indicator.
- It is a rare formation and so requires the skill and experience of the trader for detection.
- It is easy to select a stop loss and target price levels while using this indicator for making trade decisions.
- This strategy helps traders identify good potential entry points with a high reward-to-risk ratio.
Limitations
Some limitations of the concept are given below, as follows:
- There is some amount of subjectivity involved while identifying the formation because it is not easy to detect it, and traders often interpret the pattern differently, leading to variation in trade decisions.
- If traders are not patient enough to wait for a good confirmation, like a second green candle after the upward breakout, which is supported by high volume and MACD bullish crossover, etc., then they may enter an incorrect trade because the pattern sometimes false gives breakout.
- Even though it may appear across multiple asset charts, it is not very frequent, and therefore, traders do not get the chance to practice it too often during trading.
- The formation may not be so reliable in a highly volatile market, where trends keep changing frequently. Therefore, market conditions play a significant role.
Trends And Reversals
The various trend and reversal signals are commonly used tools for trading because they give profitable trades. Each of them has some standard patterns that traders use to identify them quickly. These standards include a beginning with a breakout, followed by a number of gap-ups or subsequent green bullish candles.
Drawing channels in the form of trend lines helps identify price volatility or reversal points. The channel boundary is an excellent tool for understanding at which price level there may be a reversal.
This kind of pattern is an excellent tool for reversal. It usually occurs at the top of the uptrend, meaning there is a huge possibility of a downtrend in the future. However, the prices must remain between the diamond formation trend lines because they provide a clear support and resistance level.
For professional-grade stock and crypto charts, we recommend TradingView – one of the most trusted platforms among traders.
Disclosure: This article contains affiliate links. If you sign up through these links, we may earn a small commission at no extra cost to you.

