Table Of Contents
Descending Triangle Meaning
Descending triangle is primarily a bearish chart pattern in technical analysis formed by two trendlines: a horizontal trendline acting as a support level and a descending trendline acting as a resistance level. It aims to provide traders with a bearish signal that suggests a potential downward price movement in the future.
The pattern aims to provide traders with an indication that the demand for the asset is weakening and the supply is increasing. As a result, traders may expect the price to break below the support level, leading to a potential price drop. The pattern can confirm a trading strategy or provide traders with a signal to enter or exit a trade. Traders use this pattern to identify potential short-selling opportunities and set business entry and exit points.
Table of contents
- Descending Triangle Meaning
- A descending triangle is a bearish chart pattern that suggests a potential price drop in the future.
- Traders look for a confirmation of a breakdown in price by watching for high trading volume as a signal to enter a short position.
- The pattern is visible when the price of an asset makes lower highs while the support level remains constant. This pattern suggests that the supply of an asset is increasing while demand is weakening.
- It is significant as it provides traders with an indication that the demand for the asset is weakening and the supply is increasing. As a result, traders may expect the price to break below the support level, leading to a potential price drop.
Descending Triangle Explained
The descending triangle is a technical analysis chart pattern consisting of two trend lines: horizontal support and descending resistance levels. The design is created when the price of an asset makes lower highs while the support level remains constant. This significant pattern gives traders a bearish signal indicating that the asset's price may drop.
The origin of the descending triangle pattern traces back to the early days of technical analysis when traders and analysts first started using chart patterns to predict future price movements in financial markets. Over time, it has become one of the most commonly used patterns in technical analysis, along with other popular patterns like the head and shoulders, double top, and double bottom.
Its significance is its ability to provide traders with a signal of a potential price drop, allowing them to take advantage of short-selling opportunities. This pattern can be used in conjunction with other technical indicators and analyses to confirm trading signals and identify entry and exit points for trades. Additionally, the pattern's reliability and popularity make it a valuable tool for traders to identify trends in financial markets.
How To Trade?
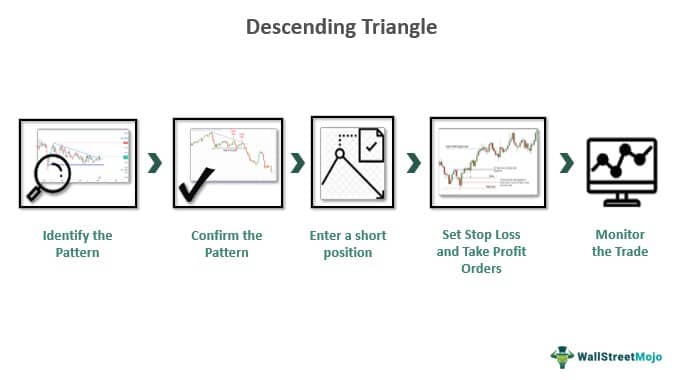
Traders typically look for a confirmation of a breakdown in price by watching for high trading volume as a signal to enter a short position. Here's a general process of descending triangle trading:
- Identify the pattern: The first step is identifying the pattern on the chart. This involves identifying the horizontal support level and the descending resistance level.
- Confirm the pattern: Once identified, traders need to confirm it by watching for a breakdown below the support level. This confirmation is typically accompanied by high trading volume.
- Enter a short position: After confirming the pattern, traders may choose a short position. This involves selling the asset with the expectation that the price will continue to drop.
- Set stop loss and take profit orders: To manage risk, traders typically set stop loss orders to limit their losses. They may also set take profit orders to exit the trade when the price reaches a certain level.
- Monitor the trade: Traders will need to monitor the trade closely, watching for any signs that the price may reverse direction or that the trade is not going as expected.
- Exit the trade: Finally, traders must decide when to exit the trade. This may involve taking profits if the price drops as expected or cutting losses if the price rises above the stop loss level.
In the chart of Bank Nifty taken from TradingView, the pattern of Descending Triangle is clearly visible. The candlesticks have formed consistent lower highs, and the lows are comparatively at the same level. Therefore, by drawing the support and resistance levels, a triangle is formed that tends to move downwards. This fact is proved over the period in future trading sessions, where the market shows a clear downtrend and falls till the next support level. The chart also shows that the trader can identify the level at which the prices may fall so as to estimate the amount of loss that they may incur. This is the length equivalent to the length of the topmost level of the triangle till the support line. A stop loss should be added up to the price level, which defines the trader’s actual capacity to bear the risk of loss.
Once the breakout happens below the support line, the trader can either exit the stock or enter a short position to take advantage of the price fall and earn profits. The situation needs constant monitoring so that the trader is able to spot the breakout immediately when it happens and decide on the next course of action. In this way, they will not miss the positive opportunity even though the market is trending downwards.
Examples
Let us understand it through the following examples.
Example #1
Suppose Harry is a trader looking at the price chart of an imaginary stock and notices a descending triangle chart pattern forming. The stock's price has been making lower highs while the support level remains constant. Harry confirms the pattern when the price breaks below the support level on high trading volume. He enters a short position, sets stop loss, and takes profit orders. He monitors the trade closely and exits the trade when the price reaches your take profit level.
Example #2
A recent real-world example of a descending triangle pattern can be seen in the price chart of Bitcoin (BTC) from June to July 2021. During this time, BTC's price formed a descending triangle pattern, with the horizontal support level at around $30,000 and the descending resistance level at about $40,000.
On July 20, 2021, the price of BTC broke the support level on the high trading volume below, confirming the pattern. This resulted in a sharp drop in BTC's worth, with the cryptocurrency losing more than 50% of its value over the next few weeks. Many traders who recognized the descending triangle pattern in BTC's chart could profit from this drop by entering short positions.
Chart

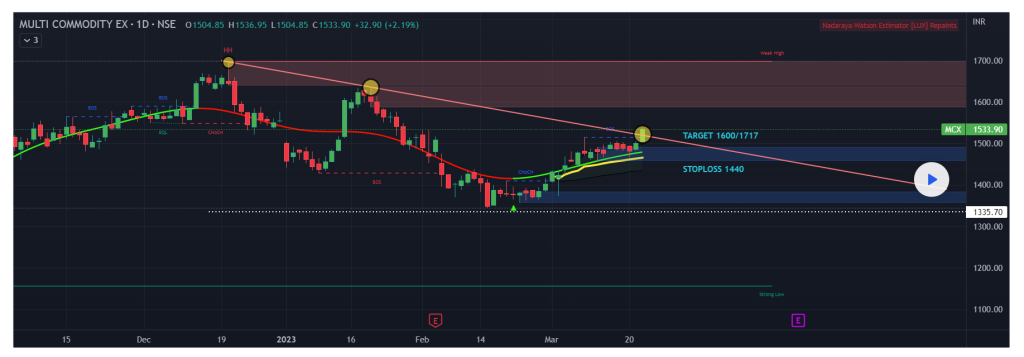
The above chart shows the price movement of security on the NSE-MCX exchange. According to the chart, the security has broken out of a descending triangle pattern on the daily charts with decent volumes. The chart suggests that the security could be bought positionally for the mentioned targets, with a stop loss order to limit losses if the trade goes against the trader.
The descending triangle pattern is a bearish chart pattern in technical analysis formed by two trendlines: horizontal support and descending resistance levels. In this case, the horizontal support level acts as a strong level of demand, while the descending resistance level represents a strong supply level.
The chart shows the breakout from the descending triangle pattern suggesting that the security price has broken down below the support level on a high trading volume. This bearish signal indicates that the security supply is increasing while demand is weakening. Traders may interpret this as a potential sign of a price drop in the future.
Descending Triangle vs Falling Wedge
Based on their definitions, the main difference between a descending triangle and a falling wedge is that the former is a bearish pattern formed by a horizontal support level and a descending resistance level. At the same time, the latter is a bullish pattern formed by a downward-sloping support level and a downward-sloping resistance level that converge toward each other.
Some of the key differences between these two patterns:
- Shape: The main difference between the two patterns is their shape. A descending triangle pattern is a bearish continuation pattern with horizontal support and descending resistance levels. In contrast, a falling wedge pattern is a bullish reversal pattern that has a downward-sloping support level and a downward-sloping resistance level that converges toward each other.
- Direction: Another difference between the two patterns is the direction in which they tend to break out. A descending triangle pattern is a bearish continuation pattern, so traders expect the price to break below the support level. In contrast, a falling wedge pattern is a bullish reversal pattern, so traders expect the price to break up above the resistance level.
- Volume: Volume is an essential factor to consider when trading both patterns, but the significance of volume differs between them. In this, traders expect a descending triangle breakout on high volume to confirm the pattern. In contrast, a falling wedge pattern may decrease volume as the pattern progresses, which can indicate a potential bullish reversal.
- Timeframe: Descending triangle patterns tend to occur over longer timeframes while falling wedges can occur over shorter timeframes.
- Market context: Another critical factor to consider when analyzing these patterns is the market context in which they occur. A descending triangle pattern may occur in a market experiencing a downtrend, while a falling wedge pattern may occur in a market experiencing a prolonged uptrend.
For professional-grade stock and crypto charts, we recommend TradingView – one of the most trusted platforms among traders.
Disclosure: This article contains affiliate links. If you sign up through these links, we may earn a small commission at no extra cost to you.
Frequently Asked Questions (FAQs)
Like all technical analysis patterns, this pattern is not fool-proof, and there is no guarantee that it will lead to a profitable trade. Therefore, traders should always use the pattern with other analysis and risk management measures to make informed trading decisions.
Trading involves risks, and traders should know the dangers of it. The pattern can sometimes provide false signals, and traders should use appropriate risk management measures, such as setting stop-loss orders to limit their losses in case the trade goes against them.
To identify the pattern on a price chart, look for a horizontal support level and a descending resistance level. The pattern is formed when the price of an asset makes lower highs while the support level remains constant.
Recommended Articles
This has been a guide to Descending Triangle and its meaning. We compare it with a falling wedge, explain it with charts, and know how to trade it with examples. You can learn more about from the following articles –


