Table Of Contents
What is a Dependent Variable?
A dependent variable is one whose value varies in response to the change in the value of an independent variable. It is the outcome of an experiment or statistical analysis; hence, also termed a left-hand-side variable usually represented as 'Y' on the graph.
The relationship between the independent and dependent variables signifies the cause-and-effect phenomenon, where any change in the value of the former triggers a change in the latter's value.
Key Takeaways
- The dependent variable is the factor, event, or value that varies when there is a change in the other variable (independent variable). It is also called a left-hand-side outcome, or response variable.
- On a graph, the left-hand-side variable is marked on the vertical line, i.e., the y axis, and is mathematically denoted as y = f(x).
- It is one of the two crucial variables of any research, i.e., science experiments, hypothesis testing, statistical analysis, or mathematical reasoning.
- Also, the dependent variable in one case can be an independent variable in another research.
Dependent Variable Explained
A dependent variable could be anything, an event, a value, or an object whose occurrence of alteration depends on the change in the independent variable. For graphical representation, the independent variable is indicated as an x-value. This is because it appears on the horizontal line—the x-axis. The outcome variable, on the other hand, is represented as a y-value on the vertical line—the y-axis. Thus, the response variable can be mathematically written as:
y = f(x)
In scientific experiments, statistics, hypothesis testing, and mathematical reasoning, results (the value of the outcome variables) are interpreted by substituting the value of the independent variables in an equation that correlates the two variables.
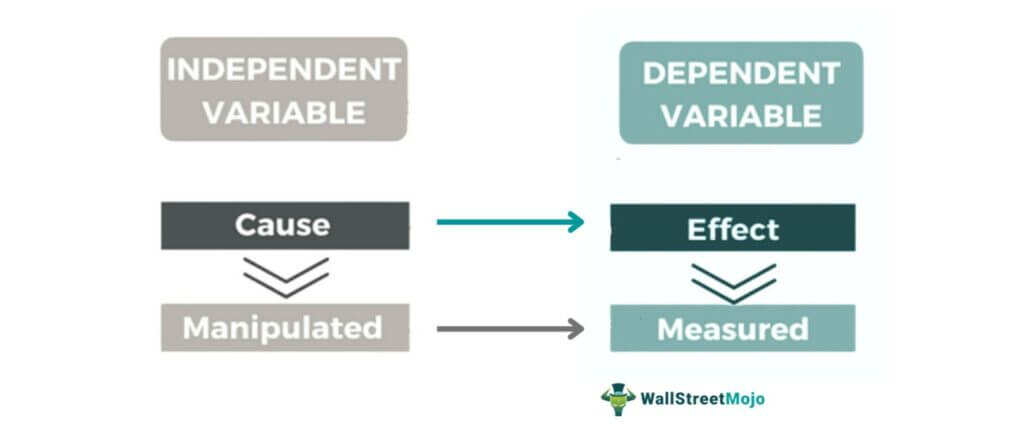
Besides, a researcher can substitute different values of X to get the desired response variable, i.e., Y. The analysis also determines the extent of outcome variable deviation—when the independent variable is changed. Dependent and independent variables are like the two sides of a coin—indispensable in research, analysis, and science. While the outcome variable is the effect, the independent variable is the cause behind it.
It is important to note that the outcome variable of one research can act as an
independent variable for another. For instance, high production cost results in a lower profit margin for a company. The reduced profit margin causes loss to the company. Here, the lower profit margin is a response variable in the first scenario but an independent variable in the second.
The outcome variable is the one whose variation is being investigated by changing inputs; in a statistical setting, they are referred to as regressors. Stability distinguishes higher-quality variables. The effects on the variable should not change when repeated—with the same participants, conditions, and experimental manipulations.
In real-world applications, the operationalization of variables is very important. Simply put, it refers to the measurement methods—a useful variable is one that can be measured.
Graph
A research analysis can be plotted on a graph when we know the outcome variables and independent variables. The independent variables are put into the given equation to acquire the output or the outcome variable:
Y = a + bX
Here,
‘Y’ is the dependent variable;
'a' is the Y-intercept;
‘X’ is the independent variable; and
'b' is the coefficient or slope.
On a graph, these variables are represented as follows:
- Dependent variables are marked on the y-axis.
- Independent variables appear on the x-axis.
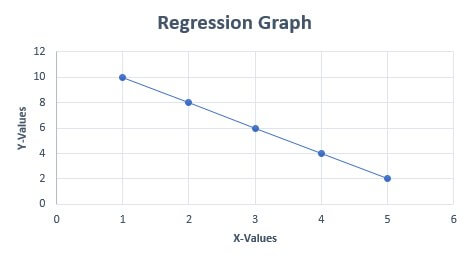
Let us assume that we have a regression equation Y = 12 - 2X. The the values of outcome variables and independent variables are given below:
Y = 12 – 2X
- 12 – 2 × 1 = 10
- 12 – 2 × 2 = 8
- 12 – 2 × 3 = 6
- 12 – 2 × 4 = 4
- 12 – 2 × 5 = 2
Now, let us plot the above data on a regression graph:
Examples
Let us look at some examples to observe the correlation between independent variables and outcome variables:
Example 1
A mutual fund plan provides higher returns when $10,000 is invested for a longer period. The increase in returns caused by extended investment duration is shown below:
Investment Period Estimated Return
1 Year - $1200
2 Years - $2544
3 Years - $4049
4 Years - $5735
5 Years - $7623
In the above example, the investment period is the independent variable, and the estimated return is the outcome variable. Now, let us plot it on a graph:
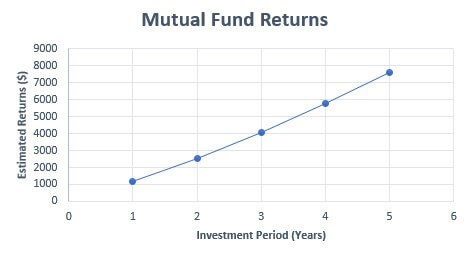
In the above graph, we can see that the increase in estimated returns depends upon the investment period.
Example 2
There is a relationship between demand, supply, and price of a product. The price of a product is dependent on its demand and supply in the market.
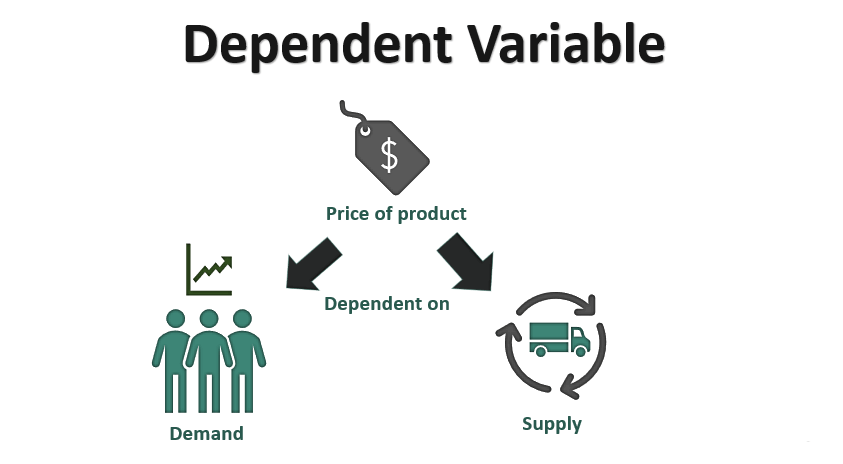
Here, price is the dependent variable; it will respond to movements in independent factors i.e. demand and supply of the product.
