Table of Contents
What Are Day Trading Indicators?
Day trading indicators are tools used in technical analysis that give signals about the entry and exit levels, support and resistance, and other market information for short-term intra-day trading.
Such indicators evaluate the price movements of financial assets and also provide information about trading volumes, which is beneficial in designing a comprehensive strategy based on market behavior. This improves the possibility of gains as well as managing risk.
Key Takeaways
- Day trading indicators and methods that intra-day traders use in the financial markets in order to take profitable trades.
- These indicators give useful data regarding entry and exit points, price trends, support and resistance, and trading volume.
- Such information should be clearly processed and used appropriately because it helps in identifying profitable trades in the market.
- They also provide risk management strategies and help in earning good returns in this competitive space.
Day Trading Indicators Explained
Day trading indicators are technical tools used in intra-day trading. They are used to detect short-term price fluctuations in the financial market as well as individual assets so as to take the opportunity to enter into profitable trades.
Such best day trading indicators help traders succeed in the competitive market and make important financial and trade-related decisions that take advantage of differences in price by analyzing price trends and support or resistance levels to decide the buy or sell points that would provide the expected return.
However, since the period is very short, the process carries a lot of risk and is prone to unexpected changes in the market, which may go against the predicted direction. Therefore, risk management is a vast and very critical necessity for day trading to minimize losses.
Traders often trade in multiple assets within the same day or trade in the same asset multiple times. For this, they take loans from brokers, referred to as margin money, which are backed by those financial assets that they buy, as collaterals. This allows traders to trade in more assets than they can actually afford to.
However, traders should always have a good understanding of the financial asset and the market that they are dealing with and, along with that, use the indicators efficiently to achieve maximum success using day trading trend indicators. This requires skill and experience.
Top 7-Day Trading Indicators
This section will deal with various best day trading indicators commonly used indicators for technical analysis in the financial market, explaining each with charts from TradingView.
#1 - Moving Average
The moving average may be a simple moving average (SMA) or exponential moving average (EMA). SMA calculates the average of stock prices for a given period, giving equal weightage to all prices. However, EMA gives more weight to the most recent prices. SMA is considered slower than EMA.
Simple Moving Average
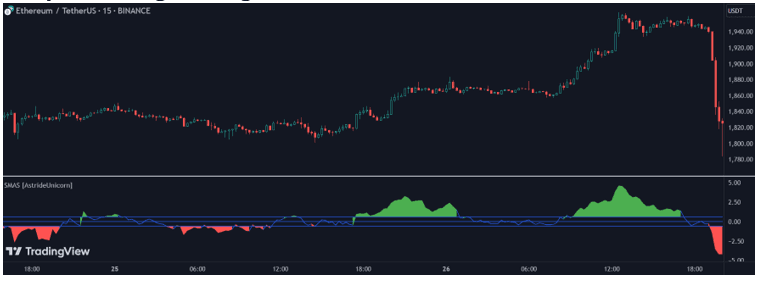
In the chart above, the SMA line shows the direction and strength of the asset price. The indicator shows the slope of the SMA of closing prices. The indicator turns green, showing an uptrend of a bullish signal, and it turns red, showing a downtrend or bearish signal.
Exponential Moving Average
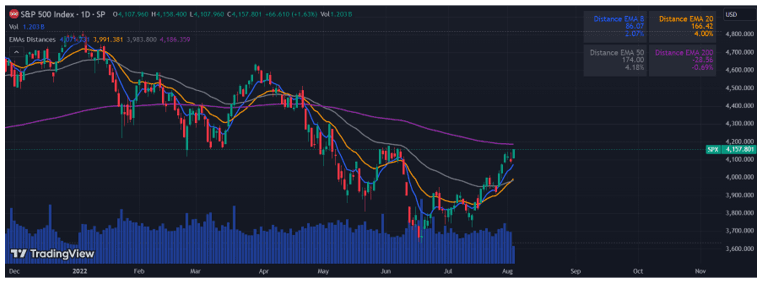
In the chart above, the 8 EMA, 20, 50 and 200 EMA are shown in different colors.
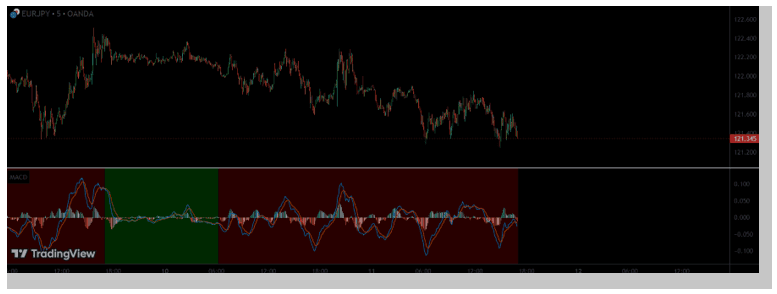
#2 - Moving Average Convergence Divergence
This day trading trend indicators is also called MACD. It is widely used to denote the direction and strength of prices to decide buy and sell points. It is calculated by subtracting the value of 26-day EMA from the value of 12-day EMA, forming the blue line or MACD line, whose convergence or divergence is compared to the red signal line, which is the 9-day EMA of the MACD line. In the chart below, the MACD shows the movement above and below the zero line. The highest peaks from where the blue line cuts the red line from below are points of buy and the possible uptrend in the future, and points where the blue MACD line cuts the red signal line from above are the sell points with the possible future downtrend.
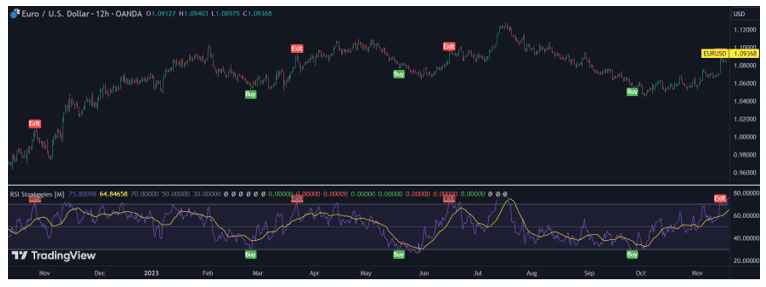
#3 - Relative Strength Index (RSI)
This momentum indicator is one of the top day trading indicators denotes how strong the price movements are in a direction and helps in identifying the overbought or oversold positions that clarify reversals. In the chart below, the buy and sell points are mentioned in green and red, respectively. The buy points are the oversold ones that are near or touching the 30 level, and the sell points are the overbought ones, toughing the 70 level.
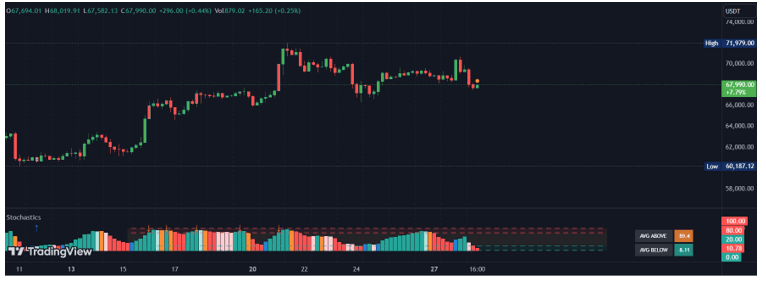
#4 - Stochastic Oscillator
This indicator is very similar to RSI but is denoted by two lines: line K, which compares closing prices of the day to the day’s trading range, and D line, which shows the average of 3 periods of K line. In the chart, the indicator shows the trend using color coding with different lines. The dark green color indicates K above D, and prices are rising. Light green indicates K above D with falling prices. Red indicates K below D with falling prices, and light red indicates K below D with rising prices.
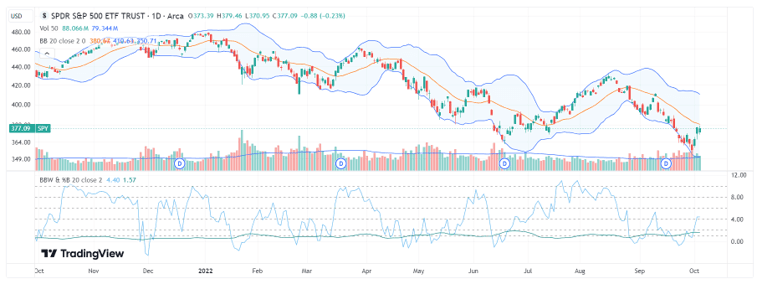
#5 - Bollinger Band (BB)
This is also a momentum indicator among top day trading indicators, which shows the deviations above and below the SMA line that passes through the middle of the BB indicator. Therefore, the BB appears to be two upper and lower bands. During high volatile periods, the band moves wide apart, and during low volatile periods, the band comes closer and may show a squeeze. In the chart below, the BB is clearly visible, with the upper and lower bands showing the volatility. Areas where the bands are close to each other are the ones with less fluctuations, and areas of bands with wide gaps represent more fluctuations.
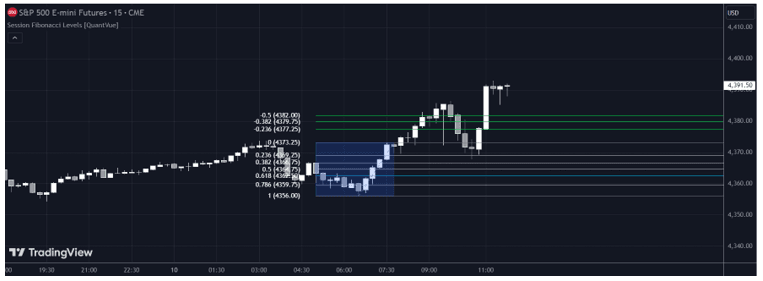
#6 - Fibonacci Retracement
Here, the indicator is among good indicators for day trading using the Fibonacci sequence, which creates the support and resistance levels within the chart based on past price patterns. Traders can identify the reversals from the various Fibonacci levels. The chart shows the different Fibonacci levels, which are identified as support and resistance levels for the financial instrument while trading. The possible supports are marked in grey, and resistances are marked in green. Traders evaluate the price targets and stop losses and also understand the market trends.
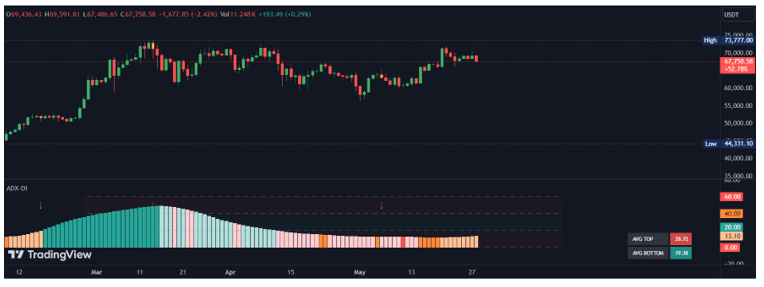
#7 - Average Directional Index (ADI)
This indicator helps traders understand the price trend in the market, along with strength. It is denoted by a range from 0 to 100. The higher the value, the stronger the trend. Therefore, it also helps with entry and exit levels. In the chart below, the ADI indicator shows the strength of the trends. When the ADI oscillator moves higher, it indicates a strong uptrend. Typically, crossing the 25 level indicates a strong uptrend. Below that, the strength of the price movement falls and shows a weak trend. This good indicators for day trading is used to spot the entry and exit levels along with trend changes.
For professional-grade stock and crypto charts, we recommend TradingView – one of the most trusted platforms among traders.
Disclosure: This article contains affiliate links. If you sign up through these links, we may earn a small commission at no extra cost to you.

