Table Of Contents
What is the Data Model in Excel?
The data model in Excel is a type of data table where two or more two tables are in a relationship with each other through a common or more data series. In the data model, tables and data from various other sheets or sources come together to form a unique table that can access the data from all the tables.

For example, a data table containing tables of customers, product items, and product sellers. We can use the Excel data model to connect this dataset and create a relationship between them.
Explanation
- It allows integrating data from multiple tables by creating relationships based on a common column.
- Data models are used transparently, providing tabular data that can be used in a Pivot Table in Excel and Pivot Charts in excel. In addition, it integrates the tables, enabling extensive analysis using pivot tables, power pivot, and Power View in Excel.
- The data model allows loading data into Excel’s memory.
- It is saved in memory, where we cannot directly see it. Then We can instruct Excel to relate data to each other using a common column. The ‘Model’ part of the data model refers to how all tables relate.
- The data model can access all the information it needs, even in multiple tables. After the data model is created, Excel has the data available in its memory. With the data in its memory, we can access the data in many ways.
Examples
Example #1
We have three datasets related to the salesperson: the first contains revenue information, the second includes the salesperson's income and the third consists of the expenses of the salesperson.

To connect these three datasets and make a relationship with them, we make a data model with the following steps:
- Convert the datasets to table objects:
We cannot create a relationship with ordinary datasets. The data model works with only Excel Tables objects. To do this:
- Step 1 - We must first click anywhere inside the dataset, click on the "Insert" tab, and click on "Table" in the "Tables" group.

- Step 2 - Check or uncheck the 'My table has headers' option and click "OK."

- Step 3 - We must enter the table's name in the "Table Name" in the "Tools" group with the new table selected.

- Step 4 - Now, we can see that the first dataset is converted to a "Table" object. On repeating these steps for the other two datasets, we know that they also get converted to "Table" objects as below:

Adding the "Table" objects to the Data Model: Via Connections or Relationships.
Via Connections
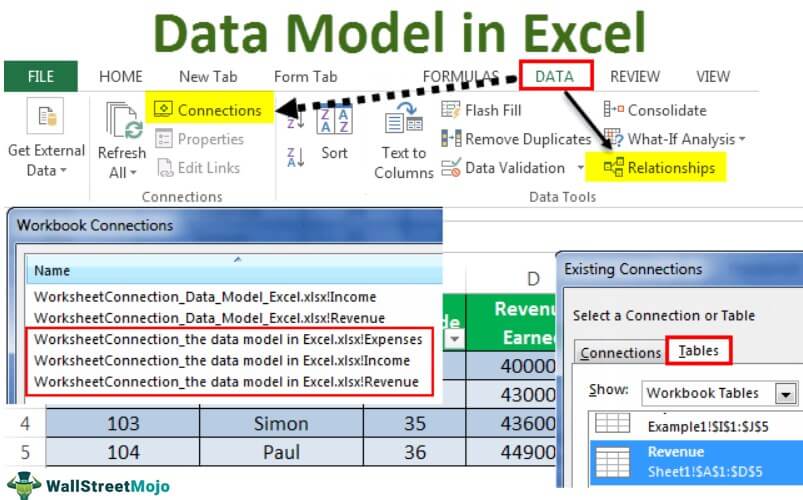
- We must select one table, click on the "Data" tab, and click on "Connections."

- There is an icon for "Add." Expand the dropdown of "Add" and click on "Add to the Data Model" in the resulting dialog box.

- Click on "Tables" in the resulting dialog box, select one of the tables, and click "Open."

In doing this, it would create a workbook data model with one table, and a dialog box would appear as follows:

So if we repeat these steps for the other two tables, the data model will contain all three tables.

We can now see that all three tables appear in the "Workbook Connections."
Via Relationships
Create the relationship: Once both the datasets are table objects, we can create a relationship between them. To do this:
- First, we should click on the "Data" tab and "Relationships."

- As a result, we can see an empty dialog box with no current connections.

- Then, click on "New," and another dialog box appears.

- Expand the "Table" and "Related Table" dropdowns: the "Create Relationship" dialog box appears to pick the tables and columns to use for a relationship. In the expansion of "Tables," we must select the dataset we wish to analyze somehow, and in "Related Table," we must choose the dataset with LOOKUP values.
- The lookup table in excel is the smaller table in the case of one to many relationships. It contains no repeated values in the common column. In expanding "Column (Foreign)," we must select the common column in the main table. In "Related Column (Primary)," we must choose the common column in the related table.

- With all these four settings selected, click on "OK." A dialog box appears as follows on clicking on "OK."

If we repeat these steps to relate the other two tables: the "Revenue" Table with "Expenses" table, then they also get connected in the data model as follows:

Excel now creates the relationship behind the scenes by combining data in the data model based on a common column: Salesperson ID (in this case).
Example #2
Now, in the above example, we wish to create a PivotTable that evaluates or analyzes the table objects:
- We must first click on "Insert" -> "PivotTable."

- We need to click on the "Use an external data source" option in the resulting dialog box and click on "Choose Connection."

- Then, we must click on "Tables" in the resulting dialog box, select the "Workbook Data Model" containing three tables, and click "Open."

- Select the "New Worksheet" option in the location and click on "OK."

- Consequently, the "PivotTable Fields" pane will display table objects.

Now we can make changes in the PivotTable accordingly to analyze the table objects as required. - For instance, in this case, if we wish to find the total revenue or revenue for a particular salesperson, then a PivotTable is created as follows:


It is an immense help in the case of a model/table containing a large number of observations.
So, we can see that the pivot table instantly uses the data model (picking it by choosing connection) in Excel memory to show relationships between tables.
Things to Remember
- We can analyze data from several tables at once using the data model.
- By creating relationships with the data model, we surpass the need for using VLOOKUP, SUMIF, INDEX function, and MATCH formulas as we do not need to get all columns within a single table.
- Models are implicitly created when datasets are imported in Excel from outside sources.
- We can create table relationships automatically if we import related tables with primary and foreign key relationships.
- While creating relationships, the columns that we are connecting in tables should have the same data type.
- With the pivot tables created with the data model, we can add slicers and slice them on any field at pivot tables we want.
- The advantage of the Data Model over LOOKUP() functions is that it requires substantially less memory.
- Excel 2013 supports only one-to-one or one to many relationships, i.e., one of the tables must have no duplicate values on the column we are linking to.

