Below is a structured comparison between Data Envelopment Analysis (DEA) and Stochastic Frontier Analysis (SFA):
Table Of Contents
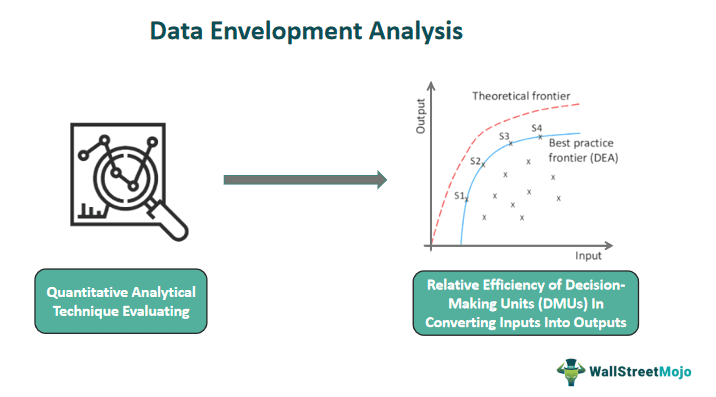
What Is Data Envelopment Analysis?
Data envelopment analysis (DEA) is a non-parametric method used for evaluating the relative efficiency of decision-making units (DMUs) within an organization. It's applied in fields like economics, operations research, and management science. DEA doesn't require a priori assumptions about the functional form of the production process, making it useful when traditional econometric methods are not applicable.
The primary aim of it is to measure the relative efficiency of various DMUs that convert multiple inputs into multiple outputs. These could be firms, organizations, departments, or any entities that transform inputs into outputs. By comparing these units, DEA helps in identifying those that achieve the highest level of outputs relative to their inputs, serving as a benchmark for inefficient units to improve their performance.
Key Takeaways
- Data envelopment analysis is a non-parametric method, making it suitable for evaluating the relative efficiency of decision-making units (DMUs)
- without imposing specific functional forms or assumptions on the production process.
- It enables the comparison of multiple DMUs by assessing their ability to convert multiple inputs into multiple outputs.
- It measures efficiency relative to the best-performing units, allowing for benchmarking and identification of inefficiencies.
- DEA accommodates multiple inputs and outputs, offering versatility in various industries and fields, such as banking, healthcare, education, manufacturing, and public sector operations.
Data Envelopment Analysis Explained
Data envelopment analysis (DEA) is a quantitative analytical technique that evaluates the relative efficiency of decision-making units (DMUs) in converting inputs into outputs. Unlike traditional parametric methods, DEA does not require a predetermined functional relationship between inputs and outputs, making it advantageous for analyzing complex systems and assessing performance without specific assumptions about the production process.
DEA originated in the late 1970s from the work of Abraham Charnes, William W. Cooper, and Edwardo Rhodes. Their objective was to develop a method to measure the relative performance of organizations in situations where conventional approaches might not apply.
This method enables the comparison of multiple units operating under different conditions by constructing an efficiency frontier, which represents the best performance achievable given the inputs and outputs. By evaluating units relative to this frontier, DEA identifies inefficient units, providing a basis for improving processes and resource allocation.
Process
Data envelopment analysis (DEA) involves several critical steps in evaluating the relative efficiency of decision-making units (DMUs):
- Identifying Inputs and Outputs: The first step is to identify the inputs and outputs relevant to the analysis. Inputs are the resources used, while outputs are the products or services generated by the DMU. For example, in a manufacturing setting, inputs might include labor, capital, and raw materials, while outputs could be the number of units produced.
- Data Collection: Gather data on inputs and outputs for each DMU. This data needs to be quantitative, reliable, and consistent across all units under assessment. It could involve financial figures, quantities, or other measurable metrics.
- Model Construction: Construct the DEA model using the collected data. DEA comes in various forms, such as CCR (Charnes, Cooper, and Rhodes) or BCC (Banker, Charnes, and Cooper). The model sets up a mathematical programming problem to determine the efficiency scores of each DMU in relation to the others.
- Computing Efficiency Scores: DEA computes the efficiency scores by comparing the inputs and outputs of each DMU to find out how efficiently they are utilizing their resources to produce outputs. Units are assessed relative to the "efficiency frontier," representing the best performance achievable.
- Identification of Efficient and Inefficient Units: DMUs achieving the maximum efficiency score are considered efficient and are positioned on the efficiency frontier. Inefficient units fall below the frontier. These units are seen as candidates for improvement since they are not utilizing their inputs as effectively as the efficient units.
- Analysis and Recommendations: Based on the DEA results, analysis can be performed to understand why specific units are inefficient. This might involve studying the best practices of efficient units and providing recommendations to the inefficient units on how they can improve their processes to become more efficient.
How To Calculate?
The calculation process in DEA involves determining the relative efficiency of decision-making units by assessing their inputs and outputs. The general steps in calculating DEA efficiency scores are as follows:
- Normalize the Data: Normalize the input and output data. Normalization is essential to bring different units of measurement onto a standard scale, enabling fair comparison. Often, data scales to a value between 0 and 1 to eliminate the impact of varying scales and units.
- Set Up the DEA Model: Choose the appropriate DEA model (e.g., CCR, BCC) based on the analysis requirements and characteristics of the data. The DEA model uses linear programming techniques to calculate efficiency scores.
- Formulate the Optimization Problem: For each DMU, formulate a linear programming problem where the inputs are divided by their weights, and the outputs are multiplied by their weights. The objective is to maximize the weighted sum of outputs while keeping the weighted sum of inputs below or equal to one.
- Solve the Linear Programming Problem: Use specialized software or mathematical programming techniques to solve these linear programming problems for each DMU.
- Calculate Efficiency Scores: The efficiency score of each DMU is determined based on the solution of the linear programming problem. An efficient DMU will have an efficiency score of 1, indicating it's operating on the efficiency frontier. Inefficient DMUs will have scores less than 1, showing they need to be fully utilizing their resources to achieve maximum output.
- Identify Reference Units: Efficient DMUs (those with an efficiency score of 1) become reference units for inefficient ones. Inefficient DMUs can learn from the efficient units to improve their performance.
- Analyze Results and Recommendations: Analyze the DEA results to understand why certain DMUs are inefficient and provide recommendations for improvements.
Examples
Let us understand it better with the help of examples:
Example #1
Suppose a university assesses the efficiency of its various departments using data envelopment analysis. The university identifies inputs (faculty, budget, facilities) and outputs (student graduates, research publications) for each department. After normalization, the DEA model is applied, and efficiency scores are calculated for each department. The analysis reveals that the computer science department has an efficiency score of 0.85, indicating it needs to be more fully utilizing its resources.
By benchmarking against the most efficient department (e.g., Engineering with an efficiency score of 1), the computer science department can identify areas to improve by reallocating resources, optimizing faculty allocation, or enhancing research output, aiming to achieve a higher efficiency score.
Example #2
A recent study of 2023 by Reserve Bank of India (RBI) economists examined the impact of bank mergers, showing varied results. The study, delving into mergers dating back to 1997 and culminating in the 2020 bank consolidation drive, uncovered that, on average, mergers enhanced efficiency and boosted shareholders’ wealth. However, diverse opinions persist. While some analyses found limited efficiency gains, others noted that profitability didn’t necessarily improve post-mergers.
Notably, the RBI's study utilized DEA, contrasting with conventional financial ratio analyses. It revealed a reduction in the average inefficiency of acquiring banks from 9.12% pre-merger to 6.2% and 5.7% three and five years post-merger, respectively. The findings diverged from earlier studies due to methodological differences, suggesting that while acquired banks might have been less efficient, the mergers didn't significantly impair overall efficiencies. This contrasts with the common belief that mergers have weighed down efficiency, reflecting the nuanced role of DEA in assessing the true impact of bank consolidations.
Applications
Data envelopment analysis finds diverse applications across various industries and sectors due to its ability to assess and compare the relative efficiency of decision-making units. Some of its critical applications include:
- Banking and Finance: Banks use DEA to evaluate the performance of branches in terms of resource utilization, customer service, and financial outputs. It helps in identifying inefficiencies and improving operational practices.
- Healthcare: Hospitals and healthcare providers utilize DEA to assess the efficiency of medical services, such as patient care, resource allocation, and hospital performance, aiding in optimal resource management.
- Education: DEA is applied in education to measure the efficiency of schools, colleges, or departments within educational institutions. It helps in optimizing resource allocation and enhancing educational outcomes.
- Manufacturing and Operations: Industries use DEA to assess production efficiency, comparing different units or factories in terms of input usage and output generation. It aids in identifying areas for improvement in the production process.
- Agriculture and Farming: Farmers use DEA to assess agricultural efficiency, comparing different farming methods or techniques in terms of input usage (like labor, water, fertilizers) and output (crop yield).
- Public Sector and Government: Government agencies apply DEA to evaluate the performance of public services, such as public transportation systems, law enforcement, and administrative operations, identifying areas for increased effectiveness.
Advantages & Disadvantages
Following is an outline of the advantages and disadvantages of data envelopment analysis:
| Advantages | Disadvantages |
|---|---|
| Non-parametric Approach: DEA doesn't require specific functional forms or assumptions about the production process. | Sensitivity to Outliers: Extreme values in data can significantly impact results. |
| Relative Efficiency Comparison: Provides a relative measure of efficiency, allowing comparison among different units. | Complexity in Interpretation: Interpreting results can be challenging due to its mathematical nature. |
| Flexibility in Multiple Inputs/Outputs: Can handle multiple inputs and outputs, accommodating complexity. | Complexity in Interpretation: Interpreting results can be challenging due to their mathematical nature. |
| Identifies Inefficiencies: Helps in identifying areas for improvement in resource utilization and performance. | Scale and Scope Effects: Different results might occur when changing the scale or scope of analysis. |
| No Need for Benchmarking: Doesn’t require an external benchmark for comparison; uses internal data for evaluations. | Computational Complexity: Computing efficiency scores can be computationally intensive, especially with larger datasets. |
| Complexity in Interpretation: Interpreting results can be challenging due to their mathematical nature. | Assumption of Constant Returns to Scale: DEA assumes constant returns to scale, which might not always hold true. |
Data Envelopment Analysis vs Stochastic Frontier Analysis
| Aspect | Data Envelopment Analysis (DEA) | Stochastic Frontier Analysis (SFA) |
|---|---|---|
| 1. Nature | Non-parametric approach. | Parametric approach. |
| 2. Assumptions | No assumptions on the functional form. | Assumes a specific functional form. |
| 3. Purpose | Measures relative efficiency among units. | Estimates the 'true' frontier of efficiency, accounting for inefficiencies and random errors. |
| 4. Modeling | It's not as complex in terms of modeling. | Accounts for inefficiencies, measurement errors, and noise while estimating the production frontier. |
| 5. Inputs/Outputs | Accommodates multiple inputs and outputs. | Usually applied to single input and single output models. |
| 6. Application | Commonly used in benchmarking and assessing relative efficiency in various industries. | Often utilized in economics, agriculture, and analyzing technical efficiency. |
| 7. Handling of Data | Utilizes all data points, allowing comparisons among different units. | Accounts for noise and errors, incorporating statistical modeling and estimation. |
| 8. Complexity | Not as complex in terms of modeling. | More complex due to statistical estimation. |
Frequently Asked Questions (FAQs)
1
Is data envelopment analysis suitable for all types of performance evaluations?
2
How do you interpret data envelopment analysis results?
3
