Table Of Contents
Dark Cloud Cover Definition
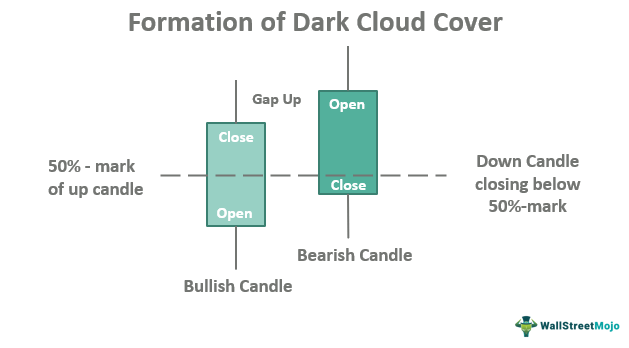
Dark cloud cover in investing is a bearish reversal candlestick pattern. Here, a down candle opens above the prior up candle’s close and closes below the midpoint of the up candle. It is often followed by another down candle, which shows a downtrend confirmation. It denotes a switch to the lower side after a price rise.

It means the asset opened at a price higher than the previous day’s close but closed lower than the previous day, and the trend is likely to continue. Thus, it predicts the fall in prices. It is a significant concept in stock trading studied by experienced investors and financial experts.
Table of contents
- Dark Cloud Cover Definition
- Dark cloud cover is a stock market phenomenon where a bearish downtrend follows a bullish uptrend. It helps the investors predict if the prices will decline.
- Usually, a down candle follows an up candle, which shows that the prices have been reduced. However, if another down candle follows the existing down candle, the stock market gets confirmation that the market is bearish, and the fall in prices is likely to continue.
- The cover is not a harmful situation in most cases. The prices usually recover within a few days.
Dark Cloud Cover Patterns Explained
Dark cloud cover is a stock market event that intricately studies the prices. The term ideally means that the tumbling prices resemble dark clouds. Before going into the depth of a bearish dark cloud cover, it is important to understand some concepts, which are also the basic requirements for the dark cover to occur.
A bearish dark cloud cover begins when an asset price has been increasing for some time but suddenly takes a turn and starts falling. This is the bearish reversal. It is predominant in initiating the cover. A reversal in the stock market means a change in the direction of an asset’s price. The bearish reversal means that the price was initially moving upward but changed direction and started falling.
The second requirement is a minimum of two dark cloud cover candlesticks – an up candle and a down candle. Candlesticks have a real body and a shadow. The real body shows if the closing price was higher or lower than the opening price. The shadows depict the highest and lowest price in a day. Therefore, a long body and smaller shadows in a dark cloud cover candlestick are considered apt. In addition, the size of the body indicates the magnitude of the reversal.
The real body can assume different colors based on the opening and closing prices. For instance, if the closing price exceeds the opening price, the real body can be white or green. This is called the up candle or bullish candle, as the price is high at the end of the day. On the contrary, if the opening price is higher, the real body can be black or red. This is the down candle or bearish candle.
Thirdly, a gap should exist between the two candles. This gap indicates that the residual buying pressure from the previous day’s close encourages more buyers to buy the stock at the beginning of the day. But later in the day, the sellers start selling off their stocks, thus pushing the price downwards. This gap gives the bearish candle a higher position than the bullish candle. The gap also signifies the degree of the reversal.
Next, the down candle should close compulsorily below the midpoint of the up candle. The closing price on the day of the bearish reversal should be more than 50% of the previous day’s close. This shows the sharp fall in prices. If it doesn’t qualify the 50%-mark, it will still be a reversal, but not a bearish one.
Lastly, confirmation is another factor that provides authenticity to the dark cloud cover. Just an up candle and a down candle will not be sufficient to predict price decline. A third-down candle, which closes further lower than the previous down candle, will rightly indicate that the prices can go down.
It is possible to understand the concept with the help of a chart from TradingView. In the chart below, the pattern is marked with the letter D and a small arrow, which makes it easier for anyone to detect the pattern formation in the chart. A small red bearish candle is formed after a green bullish candle, providing a hint of down move. Next, the possibility is confirmed because, after that, a big red bearish candle appears. Therefore, the trader gets a clear confirmation of downtrend.

Trading in a dark cover can be extremely tricky. However, the key lies in understanding a cover. All the above requirements must be appropriately satisfied for the dark cover formation. And in most cases, an increase in prices follows the cover. It can happen within a week or a month. Also, it is a recurring phenomenon and not a cause of concern mostly.
However, upon confirmation, investors can sell their stock if they want to once they have noticed the dark cloud cover. This can help them minimize losses and look for a better investment option.
Examples
Let’s discuss some examples through dark cloud cover technical analysis:
Example #1
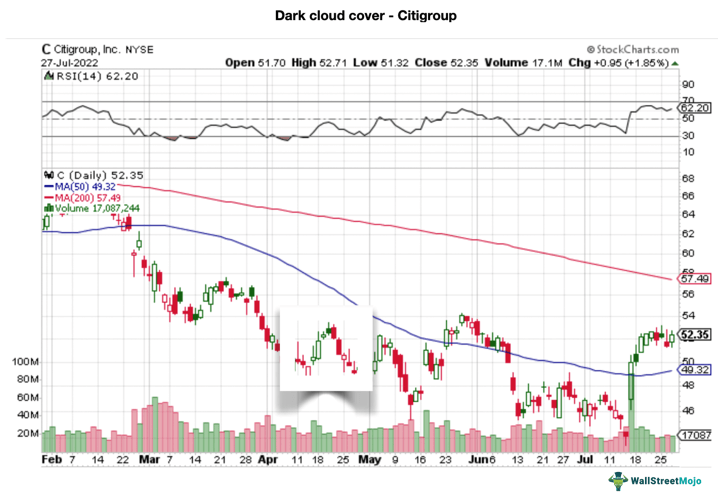
Here’s the stock performance of Citigroup, Inc. in 2022. The highlighted portion in the chart shows the dark cover. From April 13 to 20, the prices rose to $53.10 before falling to $48.21 on April 29.

The up candle is on April 20, when the stock was sold at $53.10. On April 21, the price fell to $52.63; this is the down candle. On April 22, it was reduced to $51.23; this is the confirmation. Finally, the price followed the cover pattern as it decreased to $48.21 on April 29.
However, this need not be a dark cover, as the real body of both the candlesticks is considerably small.
Example #2
Consider a FAANG stock – Amazon. In 2022, the stock price rose from $103.66 on June 16 to $116.46 on June 24; the latter is the up candle. On the next trading day, June 27, the stock fell to $113.22; this is the down candle. On June 28, it was again reduced to $107.40, which is the confirmation. Thus the dark cloud cover pattern holds true in this case.
This is a good example of a dark cloud cover pattern, as all the necessities for the cover formation are validated.
For professional-grade stock and crypto charts, we recommend TradingView – one of the most trusted platforms among traders.
Disclosure: This article contains affiliate links. If you sign up through these links, we may earn a small commission at no extra cost to you.
Frequently Asked Questions (FAQs)
Dark cloud cover technical analysis helps investors trade during bearish reversal followed by confirmation. First, the investors must identify a dark cover because there can be other phenomena resembling the cover, like bearish engulfing, shooting star, etc. Secondly, the investors can wait till the confirmation to make a selling decision. However, a cover is not always harmful, and the stock prices are likely to recover in a few days or weeks, provided the investor is in for the long run.
The opposite of the dark cover is the piercing line pattern. There are two candlesticks in this stock price phenomenon, but the down candle comes first, followed by the up candle. This is again a trend reversal, but this is a bullish reversal and shows an increase in stock prices.
The dark cloud cover is a reversal pattern in which a bearish downtrend follows a bullish uptrend. This causes the stock price, which has been increasing for some time, to decrease suddenly.
Recommended Articles
This article has been a guide to Dark Cloud Cover & its definition. We explain dark cloud cover candlestick patterns and bullish & bearish candles with examples. You can learn more about it from the following articles -

