Table of Contents
What Is Cup And Handle Pattern?
Cup and handle pattern is an important candlestick arrangement used in technical analysis, where the chart resembles a cup in the shape of a “u” and a handle formed on the right of the cup, with a slight pullback.
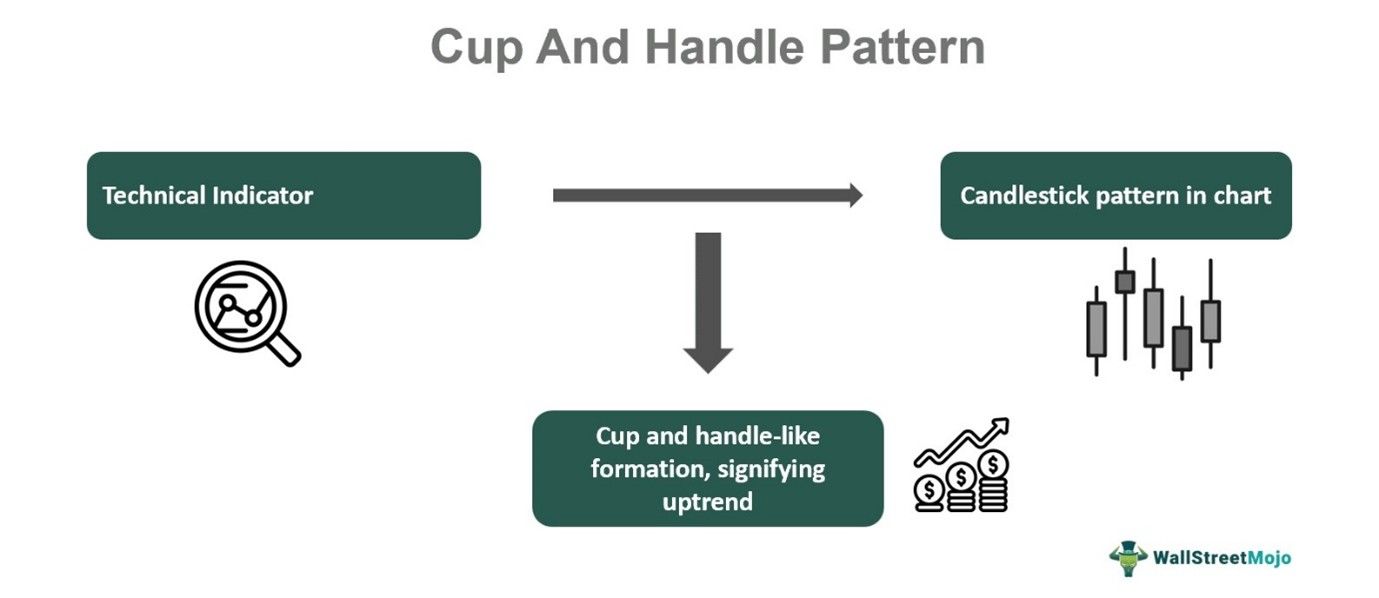
This formation happens due to a fall in price for some trading sessions and then a rise, which creates the cup, followed by the same pattern with lesser intensity, forming the handle. The drop of the handle should be close to half of the drop in the cup. This is a bullish continuation pattern, signifying the uptrend in the future.
Key Takeaways
- Cup and handle pattern is a technical indicator that traders use to detect and predict the possibility of an uptrend in the financial market.
- The candlestick arrangement resembles a cup and a handle attached to it on its right side.
- During both cup and handle formation, there are some reductions in prices and then a rise, creating the respective shapes, and the fall in the handle should be nearly half of the fall in the cup.
- The pattern is considered bullish because of a subsequent breakout from the handle, and the entire pattern takes about a few weeks or months to form within the chart.
Cup And Handle Pattern Explained
Cup and handle pattern is a type of chart pattern that depicts a cup in the shape of a “U” and a handle attached to its right side. This formation takes place due to a fall in prices for some trading sessions, followed by a rise in prices. The fall for the handle is typically almost half of the fall in the cup.
Traders use this formation widely in the financial market to identify uptrends. It indicates that the market has a bullish sentiment regarding the financial instrument, and there is a strong possibility of a rise in prices in the future, even though it may take weeks or months to show results.
This chart cup and handle pattern usually follows an already existing uptrend in the market. Therefore, it indicates that the bullish trend will be sustained in the future. William O’Neil created this indicator, and traders can aim for a long position on the right side of the cup. The confirmation of the bullish sentiment is complete when there is a positive breakout on top of the handle in the form of a green candle, signaling the continuation of the previous positive trend, which traders can also consider as the level for entering the market.
Typically, a breakout accompanies a reasonable volume. It is also possible to estimate a price target using this chart arrangement along with a stop loss to enable proper risk management during trade, ensuring that it is profitable.
Types
Various types of such chart cup and handle pattern are widely used in financial analysis, which is as given below:
- Cup and odd handle – This type of formation has an angular shape and not the usual smooth shape of a handle. This also indicates a positive trend in the future, but its reliability is considered less. Therefore, traders categorize it as a weak signal.
- Multi-year cup and handle – This cup and handle pattern target formation extends over a long period, typically many years. Here, since it takes a longer timeframe, the bottom of the cup is rounded, and the handle represents a consolidation phase, which is then again retraced back to the top of the cup. This pattern is also a bullish indicator but provides a long-term implication for the same. The handle provides the anticipation for a breakout.
- Intraday cup and handle – As the name rightly suggests, the entire formation, in this case, takes place within a day. Usually, the cup forms in the first half, and the handle forms in the second half. Short-term traders wait for a breakout above the handle to enter the market. Here, too, it is a bullish pattern, but reliability is low due to a shorter timeframe. Here, it is essential to use stop loss to manage risk and make maximum use of the opportunity.
How To Read/Interpret?
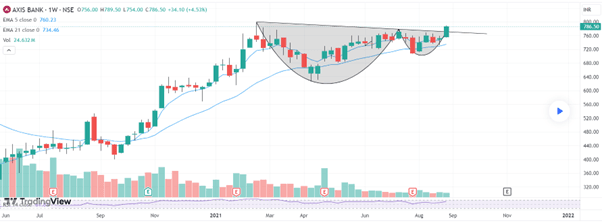
The interpretation of the chart pattern can be explained using a TradingView chart. As given below, the pattern is clearly visible in the weekly chart of Axis Bank. The cup has formed a round bottom over the week, and the handle is on the right side of the cup, whose bottom has extended down about half the fall made by the cup.
The fact that this formation is a bullish pattern is proved by the green breakout candle that has formed just at the tip of the handle, which is the resistance level, breaking it. Now, there is every possibility that the price will move up, and the target price should be of the same level as the distance between the resistance and the bottom of the cup.
How To Trade?
Typically, the market or the financial instrument is already in an uptrend before the formation of the pattern. Therefore, the prices fall at the beginning of the pattern, then start consolidation for a brief period, and finally touch the resistance line, forming a cup-like candlestick arrangement. The next is the handle, which shows a price fall but should ideally remain in the first half of the cup.
For trading purposes with a cup and handle pattern target, traders should be patient and wait for a breakout to happen from the top of the handle, which is the first impression of the uptrend. It is always better to wait for another green bullish candle because it will provide better confirmation.
Traders should enter the market at the breakout level of the following green candle and put a stop loss, which may be just below the lowest level of the handle, provided it is within the first half of the cup.
If the lowest level of the handle is already in the second half of the cup, using it as a stop loss for trade may not be profitable because it is too risky and results in a massive loss if the market moves in the adverse direction.
For this pattern, the trader calculates the price target by taking the distance between the resistance level and the lowest point of the cup and placing it on top of the breakout level.
However, it is always advisable to use it in combination with other valuable indicators so as to get better confirmation. Since it is a long-term pattern, taking weeks and months to form, using it for intra-day or very short-term analysis will not yield proper and dependable results.
Examples
The concept of cup and handle pattern stocks is easy to understand with the help of some suitable examples as given below:
Example #1
Jack is a short-term trader who noticed a cup and handle pattern in a weekly chart of AKG Pharma. The stock has been undergoing a fall and subsequent consolidation for a brief period, creating this pattern. Now, Jack is expecting a breakout from the resistance level with a bullish green candle confirming his expectation for an uptrend. At the beginning of the following week, a green breakout candle appeared. He entered at this point with a stop loss at the lowest level of the handle, which was still in the upper half of the cup. He aimed for a target price from the breakout, which is equal to the distance from resistance to the lowest end of the cup.
Example #2
Tata Consultancy Services Ltd, an IT giant, has started a steady uptrend after creating a complete cup and handle pattern in one of its weekly charts. It made a record high after that despite facing a volatile market. It provided a perfect opportunity for traders who were looking for an entry point for short to medium-term trading. This happened after the stock had to undergo a correction for a brief period during some trading sessions. However, the breakout and subsequent uptrend proved a positive market sentiment.
Advantages
Some advantages of the concept of cup and handle pattern stocks are given below:
- This pattern helps traders identify the entry and exit points for taking an ideal trade in the financial market.
- It is also a tool to manage the risk of loss by deciding on the stop loss levels.
- It is a bullish indicator. Therefore, traders can decide in advance that a long position will be ideal in such a market and accordingly design their strategies.
- It is very suitable for long-term investors because the formation takes weeks and sometimes months to appear entirely in a chart.
- Traders can use both the upside and downside of the cup pattern for trading. The downside is for a short position, and the upside is for a long position.
- The breakout is the final confirmation of an uptrend in the market, which is ideal for entry levels.
- Since it is possible to calculate the profit target, it gives a good idea of the probable profit levels that can be achieved.
- The volume at the breakout gives additional confirmation about its reliability.
Limitations
Some limitations of the concept of bullish or bearish cup and handle pattern are given below:
- Sometimes, it leads to inconsistency in results because its formation may not always be precise, and interpretation is subjective.
- It may lead to false signals. Trades may assume an uptrend, but the market may show adverse results.
- Since it takes time to form in the charts, it is suitable for long-term investors.
- Investors and traders need to be patient and wait for the pattern to complete if they want to make a confirmed trade without much risk. Therefore, it is time-consuming.
- Traders need good experience and skill and have a solid understanding of how to manage the risk of loss in case of bullish or bearish cup and handle pattern.
For professional-grade stock and crypto charts, we recommend TradingView – one of the most trusted platforms among traders.
Disclosure: This article contains affiliate links. If you sign up through these links, we may earn a small commission at no extra cost to you.

