Table of Contents
What Is The Cumulative Logit Model?
A cumulative logit model is used to predict an ordinal response. The model is based on the assumption of proportional odds. Ordinal responses are when there are multiple responses provided to a query, and the frequency of each response has to be reported; the most common are Likert scales for agreement, disagreement or statements.

The proportional odds assumed in the cumulative logit model believe that the coefficient of each predictor category should be consistent with a parallel slope across all response levels. It is a direct extension of the usual logistic model, and the same proportionality constant applies to each logit.
Underbanked Meaning
Key Takeaways
- The cumulative logit model is used to fit continuous ordinal data to provide the probable ordinal response.
- The model is based on the assumption of coefficient consistency among each category response, which is also referred to as proportional odds.
- It is mostly used in marketing surveys, product reviews, psychometric tests, and scientific research.
- It can be used with software tools and programming languages, and the model is flexible enough to fit into different frameworks.
Cumulative Logit Model Explained
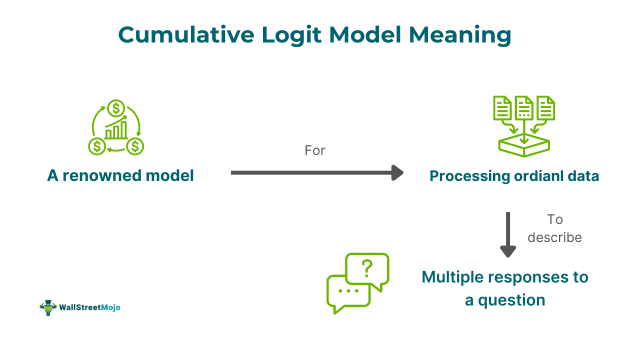
The cumulative logit model is a renowned model for processing ordinal data, which is used to describe multiple responses to a question. The model applies cumulative probabilities to the extent of making the whole range of ordinal categories binary at that point or threshold. In statistics, the logit or logistic model helps define the probability of an event taking place by having the log odds for the event regardless of whether it is a linear combination or has multiple independent variables. The model majorly works for ordinal data, which is classifying the data with an established order or ranking; the responses are mostly used when conducting a survey or a test in which questionnaires are distributed.
When a survey is conducted using a Likert scale and responses are rated with multiple options, the cumulative logit model is best suited for the analysis of ordinal response data because it takes into account the ranked order inherent in ordinal response data, as well as the adjustment of confounding and the assessment of the effect modification of sample size.
The main limitation of the logit model is that it is based on assumptions and requires complex calculations, which means that deducing and defining the outcome from the model may require software-based tools and advanced interpretation skills. It is used when there are more than two responses involved in the test to understand the attitude, opinions, and behavior of the respondent regarding the underlying aspect. The logistic model is popular because of its accuracy and consideration of multiple responses for a test.
Formula
The formula for this model is mentioned below:
Cumulative logit model = logit = log P(Y ≤ j|x) 1 − P(Y ≤ j|x)
- P = probability of outcome.
Examples
Below are two examples of the cumulative logit model; one is simple, and the other is of fitting the cumulative logit model in R:
Example #1
Suppose a company that manufactures dark chocolates surveys with one question: How do people like the taste of their dark chocolate? The company offers four answers: poor, average, good, or best. The company surveys 99 random people they meet in the open market. Once the answers are collected, the company applies the cumulative logit model to derive the ordinal response, which is commonly used in Likert scale scenarios such as the survey. The technique also employs the log table for calculation.
The whole model assumes that the categorical variables must be consistent. Now, a survey with a scale that explains the opinions, attitudes, and behavior of the respondents can have multiple questions. In such cases, the logit model calculations become more complex and require the help of different software-based models such as R, Python, or SAS.
Example #2
The second example shows how the cumulative logit model is fitted in R. It revisits housing satisfaction with three response levels: low, medium, and high, ordered from least to greatest satisfaction. The example shows that the probability of medium or less satisfaction makes sense, given that the categories have a defined order.
Given the scenario, the cumulative logit model is then -
log(P(Y≤j)P(Y>j))=β0j+β1jx1+β2jx2+⋯for j=1,2
Here, the predictor set is identical to the baseline model; the odds are defined differently, but the model is similar to the baseline model. Each of 3 - 1 = 2 response categories in its logit equation (each of the β coefficients has indices for both its predictor and the jth category) yields the same parameters and degrees of freedom for goodness of fit. The calculation gets more complex, and the same model is also fitted in SAS.
