Table Of Contents
What Is Cross-Sectional Data Analysis?
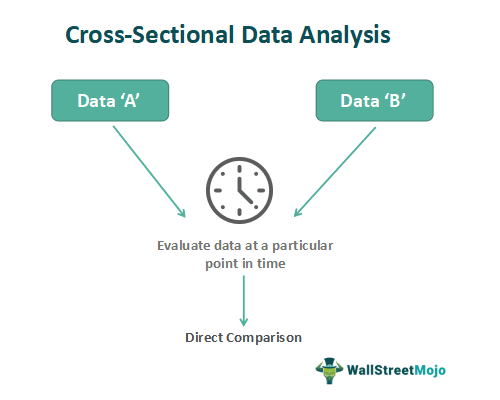
Cross-sectional data analysis is a technique that involves evaluating and assessing multiple datasets simultaneously. This method enables a straightforward comparison across sectors and industries, focusing on various factors such as profits, earnings per share, cash flows, etc.
Cross-sectional data analysis is utilized in various fields, such as corporate finance and econometrics. It enables analysts to gain insights into companies, sectors, and economies. In addition, by comparing different entities or variables, cross-sectional analysis assists in decision-making processes, evaluating alternatives, and establishing a baseline for comparison.
Key Takeaways
- Cross-sectional data analysis involves evaluating data collected at a specific point in time, making it suitable for side-by-side comparisons. It is commonly used in finance and econometrics.
- One significant area where cross-sectional analysis is applied is disease and healthcare.
- By assessing millions of data points from various geographic regions, this analysis aids in studying pandemics, endemics, disease identification, and prevention.
- It can be categorized into two types: pooled cross-sectional analysis and repeated cross-sectional analysis.
- The pooled analysis involves adding independent datasets over time, while repeated analysis entails conducting analyses at regular or irregular intervals with different datasets each time.
Cross-Sectional Data Analysis Explained
Cross-sectional data analysis methods evaluate multiple datasets at a specific point in time. Thus, these methods enable effective comparisons of companies within a sector or industry and serve as invaluable tools for analysts and investors alike. This facilitates the understanding of sector performance and prevailing market conditions. Thus, analysts gain insights into different sectors' performance, trends, and characteristics by examining various factors beyond financial statements.
Industries often exhibit varying performance due to economic conditions. For example, the impact of the COVID-19 pandemic differed for internet companies and the textile sector. Therefore, conducting a cross-study of representative companies within a sector helps comprehensively understand average performance and prevailing market conditions.
Investors can leverage cross-sectional analysis to compare sectors and make informed investment decisions. Econometrics and other domains also benefit from this methodology, such as population studies, market preferences, consumer behavior, and trends.
There are two primary cross-sectional techniques. The first is repeated cross-sectional data analysis, involving analyses conducted at regular or irregular intervals with different datasets each time. For instance, a yearly survey administered to random participants can help understand evolving views or perceptions.
The second technique is pooled cross-sectional data analysis, incorporating independent datasets accumulated over time. This comprehensive approach enhances data accuracy by pooling new research data with existing datasets. For example, incorporating this year's research data on people's perceptions of cryptocurrencies into a decade-long study provides a more comprehensive understanding.
Examples
Let's look into some examples for a better understanding of the concept:
Example #1
Suppose Ray is a retired investor. He manages investments by himself. Ray had to compare two companies' stocks – A and B. Ray was looking for a long-term investment. Therefore, he had to study the companies thoroughly. He undertook a cross-sectional analysis and evaluated the profits, EPS, P/E ratio, cash flows, investments, capital structure, liquidity, resilience over the years, stability, etc.
Example #2
The Asian Development Bank (ADB) recently published research to establish the relationship between entrepreneurial activity in a country to its economic growth using cross-sectional analysis. Previous studies have shown a positive link between entrepreneurship and economic growth. Specifically, one study by Galindo and Méndez showed that economic growth promotes entrepreneurial activity, which again promotes economic growth.
The research considers 111 developed and developing economies. The key independent variable is total early-stage entrepreneurship (TEA), which is divided into opportunity-driven early-stage entrepreneurship (OEA) and necessity-driven early-stage entrepreneurship (NEA). The key dependent variable is GDP (Gross Domestic Product) growth and GDP per capita growth. Here are the insights based on the analysis:
- There is a positive relationship between overall TEA and economic growth.
- There is a positive link between total NEA and economic growth.
- A negative relationship was identified between overall OEA and economic growth.
- TEA and NEA are highest in developing economies.
- OEA is highest in developed economies.
Advantages And Disadvantages
The main advantages and disadvantages are as follows:
#1 – Advantages
- Cross-sectional analysis helps study large amounts of data. This is especially true in the case of population studies that use millions of data points across different regions, where cross-sectional analysis helps produce insights conveniently.
- Multiple parameters can be analyzed, and insights identified in a specific period. For example, EBIT (Earnings before interest and tax), reserves, debt-equity ratio, etc. Multiple outcomes can also be explored using the technique.
- Cross-sectional analysis is cheaper than other methods, specifically when secondary data is used. However, even if primary data is collected, the use of online resources will greatly reduce costs.
- The technique can help establish the relationship between variables. This is useful in correlation and regression analysis. For instance, it is possible to understand the direction and extent of the relationship between a company's profits and liquidity ratio.
- It serves as a preliminary study before the actual research. For this purpose, secondary data is sufficient to understand the market, demographics, customer preferences, etc. Based on this, the actual research methodology can be planned.
#2 – Disadvantages
- The cross-sectional analysis depends entirely on data. Therefore, data accuracy and reliability are extremely important for the analysis to yield appropriate results. Otherwise, the whole process would be futile. Therefore, due care should be taken, especially when using secondary data.
- Information bias is an inherent flaw in research studies where participants withhold information or falsely communicate inputs. Unfortunately, the cross-sectional technique is not immune to this flaw and can seriously affect the utility of insights.
- The method cannot help determine the cause-effect relationship in the data available. Thus, it addresses 'how much' and 'what' but not 'why.' For this, other qualitative techniques should be used.
- Finally, the technique is most suitable for studies conducted at the same time and not over a period, which would be able to give more useful insights.
