Table Of Contents
Covariance Matrix in excel
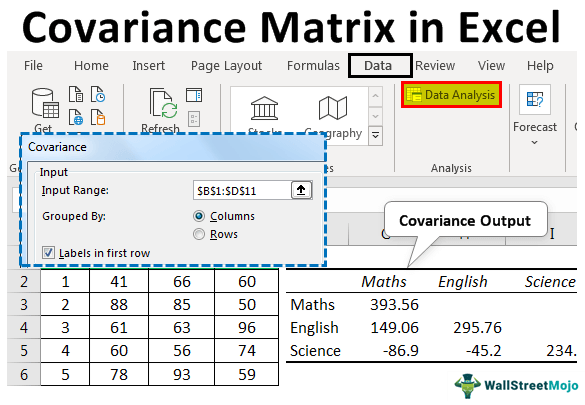
The covariance matrix is a square matrix to show the covariance among the columns and variance in columns. Excel presented an inbuilt "Data Analysis" tool to determine the covariance between the data sets. The present article will explain the covariance matrix calculation in Excel by covering the following topics.
For example, suppose we have an Age(X) and Score (Y) dataset. We need to determine the joint variability of the given variables in a dataset. In such a scenario, we can use the covariance matrix function that helps to display the covariance between a pair of datasets and the variance shown by the dataset elements.
Explanation
Covariance is one of the measures used for understanding how a variable is associated with another variable. The following formula is used for covariance determination.
COV (X,Y) = ∑(x - x) (y - y) / n
The covariance matrix is a square matrix to understand the relationships presented between the different variables in a dataset. It is easy and useful to show the covariance between two or more variables.
The covariance will have both positive and negative values. A positive value indicates that two variables will decrease or increase in the same direction. A negative value indicates that if one variable decreases, the other increases, and an inverse relationship exist between them. The covariance matrix is represented in the following format. The three-dimensional covariance matrix is shown as:

To create the 3×3 square covariance matrix, we need to have three-dimensional data. The diagonal values of the matrix represent the variances of X, Y, and Z variables (i.e., COV(X, X), COV(Y, Y), and COV (Z, Z)). The covariance matrix is symmetric concerning diagonal. This indicates that COV(X,Y)=COV(Y,X), COV(X,Z)=COV(Z,X), and COV(Y,Z)=COV(Z,Y). One point to remember about this matrix is the result from the NXN covariance matrix for data of n-dimensional.

How to Use a Covariance Matrix in Excel?
The covariance matrix is used in various applications, including:
- Analyzing how two vectors are differentiated from each other.
- In machine learning, determine the dependency patterns between the two vectors.
- The covariance matrix tells the relationship among the different dimensions of random variables.
- It can be used in stochastic modeling in financial engineering to correlate the random variables.
- The principal component is another application of the covariance matrix to original variables to linear independent variables.
- In data analysis, the covariance matrix has a vital role.
- The covariance matrix is utilized in modern portfolio theory to estimate risks.
- The measures of the covariance matrix are used in anticipating the returns on the financial assets.
Examples of Covariance Matrix in Excel
Below are some examples of using the covariance matrix in Excel.
Example #1
Performing covariance analysis on the marks obtained by students in different subjects.
Step 1: The following data, including the marks of students in Mathematics, English, and Science, are considered as shown in the figure.

Step 2: First, we must go to the “Data” tab on the ribbon and find the “Data Analysis“ ToolPak on the right side corner.
If Data analysis ToolPak is not available, then follow these steps.
Step A: First, we must go to the "File" tab and select the "Options."

It will open the following screen.

Step B: Then, we need to go to "Add-ins." Under the "Manage Option," ensure that "Excel add-ins" are selected and select the "Go" button, as shown in the figure.

Step C: Select the “Analysis ToolPak” and “Analysis-ToolPak VBA,” as shown in the screenshot.

After completing these steps, the "Data Analysis" ToolPak is added to the "Data" tab.

Step 3: We need to click on "Data Analysis." As a result, it opens the "Data Analysis" dialog box. Select the "Covariance" by scrolling up and clicking on "OK."

It displays the “Covariance” dialog box.

Step 4: Next, we must select the input range, including the subject names, check the "Labels in first row," and give the "output range" in the existing worksheet. And click on "OK."

Step 5: We will get the output as follows –

The upper part of the diagonal is empty as the Excel covariance matrix is symmetric towards the diagonal.
Example #2
Perform a calculation of the covariance matrix to determine variances between the returns of different portfolio stocks.
Step 1: For this example, the following data, including the stock returns, are considered.

Step 2: We need to open the "Data Analysis" dialog box and select the "Covariance" by scrolling up and clicking on "OK."

It displays the “Covariance” dialog box.

Step 3: We must select the input range, including the headers, check the "Labels in first row," and give the "Output Range" in the existing worksheet. And click on "OK."

Step 4: We will get the output as follows –

The upper part of the diagonal is empty as the covariance matrix is symmetric towards the diagonal.
Example #3
Calculation of covariance matrix for stock prices of corporate companies
Step 1: For this example, the following data, including stock prices of different companies, are considered.

Step 2: We have to open the "Data Analysis" dialog box and select the "Covariance" by scrolling up and clicking on "OK."

It displays the “Covariance” dialog box.

Step 3: Next, we must select the range of input, including the headers, check the "Labels in first row," give the "Output Range" in the existing worksheet and click on "OK."

Step 4: We will get the output as follows –

Things to Remember
- The covariance tool presented by Excel has some limitations, including the determination of only population variances formula, creation of matrix with only lower diagonal values, and consideration of formulae only for a variance.
- When return values are changed, it doesn’t automatically update the values of the matrix.
- The upper half of the matrix is empty since it is symmetric, and mirror-image values are shown in the lower diagonal.

