Table Of Contents
CORREL in Excel
The CORREL function is categorized as a statistical function in Excel. The CORREL formula in Excel is used to find out the correlation coefficient between two variables. For example, it returns the correlation coefficient of array1 and array2.
For example, – The correlation between a particular stock and the market index.
You can use the correlation coefficient to determine the relationship between the two properties.
CORREL Formula in Excel

The CORREL formula in Excel has two critical parameters, i.e., array1 and array2.
Compulsory Parameters:
- array1: It is required a set of an independent variable.
- array2: It is a set of the dependent variable.
Remarks
The correlation coefficient formula is:

X and Y are the sample means calculated by average(array1) and average(array2).
If the value of the correlation coefficient r is close to +1, it indicates a strong positive correlation, and if r is close to -1, it shows a strong negative correlation.
CORREL Excel Function - Video Explanation
How To Use The CORREL Function in Excel?
The CORREL function in Excel is very simple and easy to use. Let us understand the working of CORREL with some examples. The CORREL function in Excel can be used as a worksheet function and as a VBA function.
CORREL function as a worksheet function.
Example #1
In the first example, let us consider two sets of data, Data1 and Data2, as shown in the below table.

=CORREL(B4:B22,C4:C22) =0.6642909
Example #2
This example considers the data set of weekly changes for stock A as "Data1" and SP 500 weekly changes as "Data 2," shown below. Then, calculate the correlation coefficient function using the CORREL formula in Excel =CORREL(F3:F23,G3:G23), and the output will be 0.89011522.

Example #3
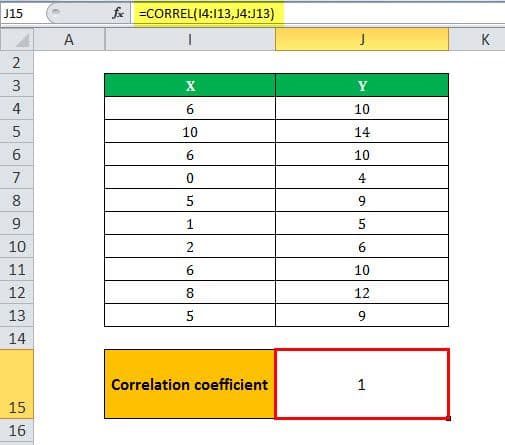
In this example, we take a perfect positive correlation; For example, considering a variable X value increases with the value of a variable. The value of variable X decreases as the value of variable Y decreases, as shown in the table below.

Example #4
We consider an example of a perfect negative correlation, as the value of variable X increases when the value of variable Z decreases. But, conversely, as the value of variable X decreases, the value of variable Z increases, as shown in the below example.

CORREL function in Excel can be used as a VBA function.
Let us consider a dataset in excel that starts from A2.
Sub CORRELfunction()
Dim r As Double
Dim ra As Range
Dim rb As Range
Set ra = Range("A2", Range("A2").End(xlDown)) //ra stores the ranges from A2 to last entry in column A.
Set rb = ra.Offset(, 1) //rb stores the array values from C2 to all values in column C.
r = Application.WorksheetFunction.correl(ra, rb) //Correlation function value is stored in r variable.
MsgBox r //prints the output in Message Box.
End Sub
Things to Remember
- #N/A Error – The (CORREL) correlation function in Excel through the #N/A error if the given arrays are of different lengths. If array1 and array2 contain different numbers of data points, CORREL will return the #N/A error value.
- #DIV/0 error – Correlation function in Excel through the #DIV/0 error if either of the given arrays (array1, array2) are empty or if the Excel standard deviation of the values equals zero.
If the supplied array or reference argument contains text/string, logical values, or an empty value, those values are automatically ignored.
- The (CORREL) correlation function in Excel includes the value zero in its calculation.

