Below is a comparison between control limits and specification limits:
Table Of Contents
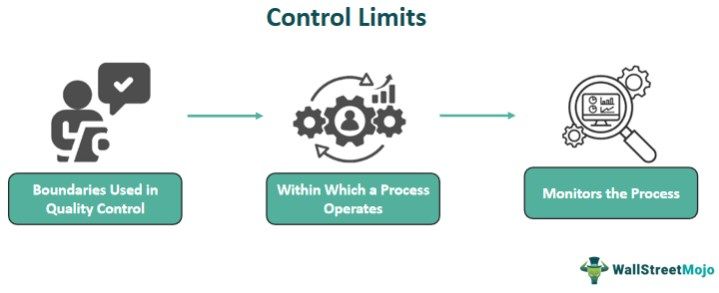
Control limits, also known as process control limits or specification limits, are statistical boundaries used in quality control to monitor and manage a process. They define the range within which a process is expected to operate under normal and stable conditions. Control limits consist of upper and lower limits that help identify whether a process is in control or out of control.

The aim of it is to ensure process stability and detect any potential variations or abnormalities in the output. By establishing these limits, organizations can systematically analyze and improve their processes, ultimately enhancing product or service quality. When data points fall within the control limits, it suggests that the process is operating as expected.
Key Takeaways
Control limits are predetermined boundaries that encapsulate the expected variability of a process under normal conditions. Originating from the pioneering work of Walter A. Shewhart in the early 20th century, control limits find their roots in the field of quality management and industrial statistics. Shewhart, a renowned physicist and statistician, introduced the concept as a part of his groundbreaking work at Bell Labs to improve manufacturing processes.
These limits serve as sentinel markers, delineating the acceptable range of variation for a given process. The upper and lower control limits are based on historical data and statistical analysis. This allows organizations to distinguish between common cause variation (inherent to the process) and particular cause variation (indicative of an external factor or anomaly). The utilization of control limits empowers practitioners to identify deviations from the norm promptly, triggering investigations into the root causes of anomalies.
Control limits represent a fundamental aspect of quality assurance, fostering the proactive management of processes to enhance consistency and minimize defects.
The calculation of control limits involves statistical methods to define the expected range of variation for a process. Two common types of control limits are the Upper Control Limit (UCL) and Lower Control Limit (LCL). Here's a general overview of the calculations:
These control limits establish the boundaries within which the process is expected to operate under normal conditions. Deviations beyond these limits may indicate a need for investigation and potential corrective action. The specific multiplier (e.g., 3-sigma, 2-sigma) depends on the desired level of confidence and the characteristics of the process being monitored.
Let us understand it better with some examples.
Let's consider an imaginary scenario where a coffee shop is monitoring the brewing time of its espresso shots. The goal is to ensure consistency in the brewing process. We'll calculate the Upper Control Limit (UCL) and Lower Control Limit (LCL) using a three-sigma control chart.
Here, the control limits for the brewing time of espresso shots are approximately 22.621 seconds (LCL) to 28.279 seconds (UCL). The coffee shop can use these limits to identify whether the brewing process is within acceptable bounds. If any brewing time falls outside this range, it may signal the need for investigation and potential adjustments to the process.
In 2023, the National Payments Corporation of India (NPCI) implemented new rules for RuPay credit card transactions on the Unified Payments Interface (UPI). The transaction limits for RuPay credit cards on UPI have been lowered, affecting users' ability to conduct high-value transactions. The new guidelines, set by NPCI, aim to enhance security measures and prevent potential risks associated with electronic transactions. Control limits play a crucial role in this context, as they establish an acceptable range of transaction values.
Implementing control limits in a process offers a range of benefits across various industries:
While control limits are a valuable tool for quality control and process management, they come with certain drawbacks that organizations should be mindful of:
Below is a comparison between control limits and specification limits:
| Aspect | Control Limits | Specification Limits |
|---|---|---|
| 1. Focus | Monitor and control the stability of a process Internal process management | Define acceptable limits for customer requirements External customer satisfaction |
| 2. Variability | Reflects inherent process variability | Specifies acceptable variation for end-user needs |
| 3. Calculation | Based on statistical analysis of process data | Often determined by external standards or regulations |
| 4. Flexibility | Can be adjusted based on process improvement | Generally static and less subject to frequent change |
| 5. Responsibility | Primarily managed by the organization | Typically set by industry standards or customer needs |
| 6. Usage in Control Charts | Central to constructing control charts
| Not directly used in control charts but in quality specifications |
| 7. Example | Monitoring the temperature in a manufacturing process | Ensuring a product's dimensions meet specified measurements |